Interactive Visualizations
Data Apps
Shapelets is built with more powerful new features and dynamic visualizations.
Key Benefits
Shapelets platform acts as a server application that provides access to the data and data visualizations (data apps) through a browser (client). These data apps or web applications contain widgets that can be used to interact with the data stored in the system and to select parameterizations and trigger computations in the server/cluster based on the selected parameters.
We have enhanced the interactive visualization features to make it easy for a data scientist to create clear, simple, and intuitive data apps. It allows data teams to get a better understanding of the data, manage multiple scenarios and keep track of them. No need for third-party tools or a visualization team to build advanced, professional visualizations.
Quick access to all the controls you need, exactly when you need them. It is easier and richer than ever.
Main Components
Agile visualization
Navigate quickly over large time series through smart handling of the data.
High-quality information with fewer resources. You can now explore and manage multiple large time series through our improved line charts. No more frozen browsers, these features allow drag and zoom operations over multiple time series datasets simultaneously. You can handle more data than other tools and keep speed and quality. In multi-lane charts, lanes can be displaced as needed. Extremely simple to switch the left and right axis or to enable/disable time series.
Immediate sharing
Build a Data app with a few lines of code and share it immediately.
Shapelets data apps are Python constructions based on the Shapelets API that can be easily deployed and published. By calling a registering method, the data app is instantly visible to other users on the server and later updates and/or fixes will be available as soon as implemented. Additionally, Shapelets provides different levels of permissions on data apps and databases (read/write/admin) to ease the internal handling of the access control system.
Versatile widget interactions
Thanks to our interactive data visualizations data teams will have a variety of widgets to deploy in professional data apps.
Easy building of data apps with complex behaviours and interactions connecting with the Python API. The user will observe and interact with the data and manage computations directly from the browser. It is the Shapelets Python API the one that allows for the easiest layout of widgets or UI visual components. These can be embedded in data apps and rendered in web applications. Great versatility when events can be rapidly connected with actions to trigger changes or executions, allowing complex behaviours when multiple actions are chained.
3rd party libraries
Shapelets API offers various libraries to create advanced visualizations such as interactive charts and maps.
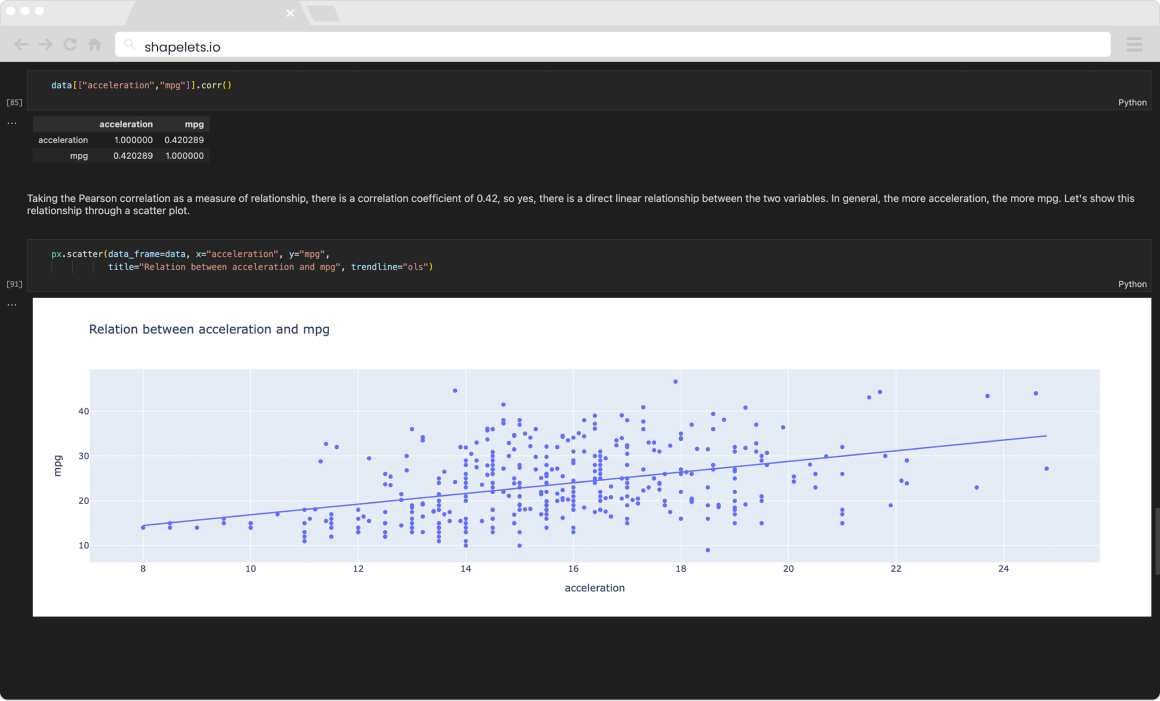
You can use your favourite Python library and easily embed them in Shapelets data apps. The library offers interfaces to various plotting or visualization libraries in Python. The user can easily create visualizations using directly a specific visualizations library such as Matplotlib, Altair or Folium, and others. No need to change tools or learn new syntax. No limits. Embed your visualization components directly using wrappers.
