shapelets.apps.DataApp.line_chart#
- DataApp.line_chart(data: Optional[Union[List[int], List[float], List[str], ndarray, DataFrame, Series, DataSet]] = None, title: str = None, views: List[View] = [], multi_line_chart: bool = True, multi_lane: Optional[bool] = True, **additional) LineChartWidget#
Creates a Line Chart figure. It represents either a Sequence or X and Y axis.
Note
If you need a time index in the Line Chart, your dataset must have a column called index with dates.
- Parameters:
- dataDataSet, List[int], List[float], List[str], np.ndarray, pd.DataFrame or pd.Series, optional
data to be represented.
- titlestr, optional
String with the Line Chart title. It will be placed on top of the Line Chart.
- viewsList[Views], optional
Views to be represented inside the Line Chart.
- multi_line_chartbool, optional
Try to plot multiple lines. (default True)
- multi_lanebool, optional
Plot one chart per lane. (default True)
- Returns:
- LineChart
Examples
You can create a line chart using this:
>>> line_chart = app.line_chart(title="Linechart", data=df)
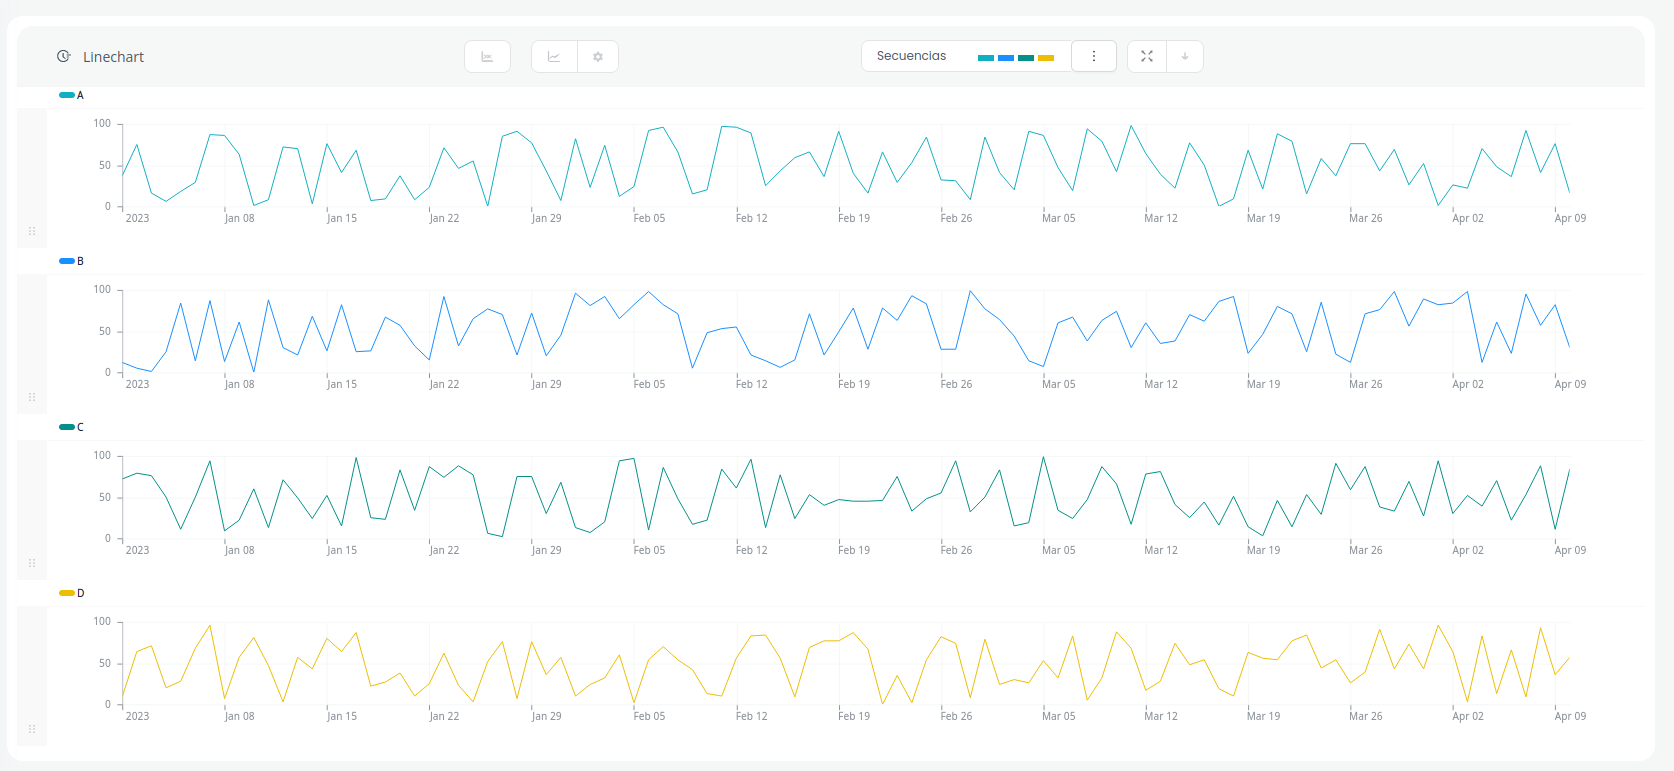
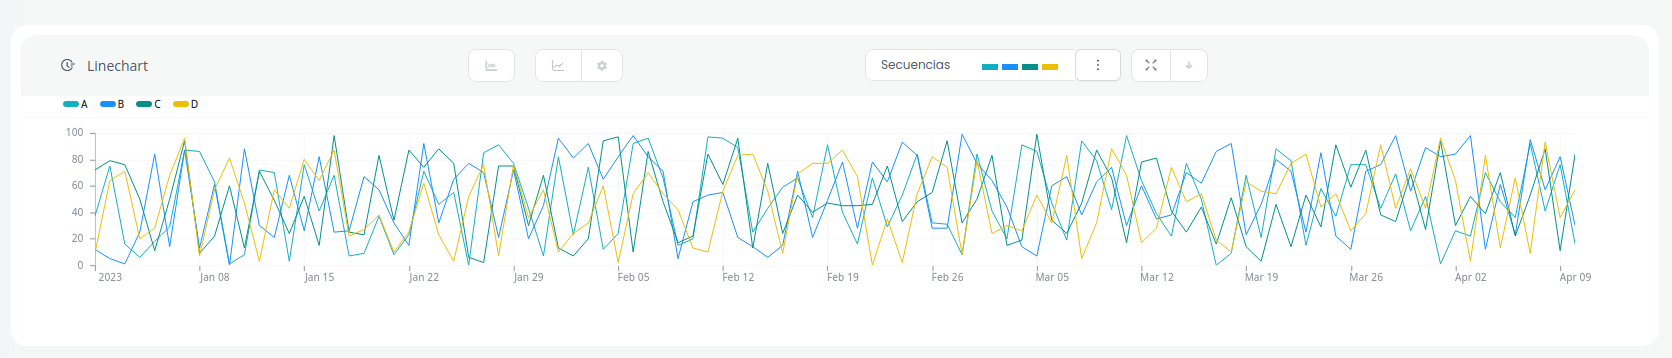
By default multi_lane=True, so if your dataframe have more than one time series will plot in a separated lanes. You can set it to False you can get a line chart with only one line.
>>> line_chart = app.line_chart(title="Linechart", data=df, multi_lane=False)
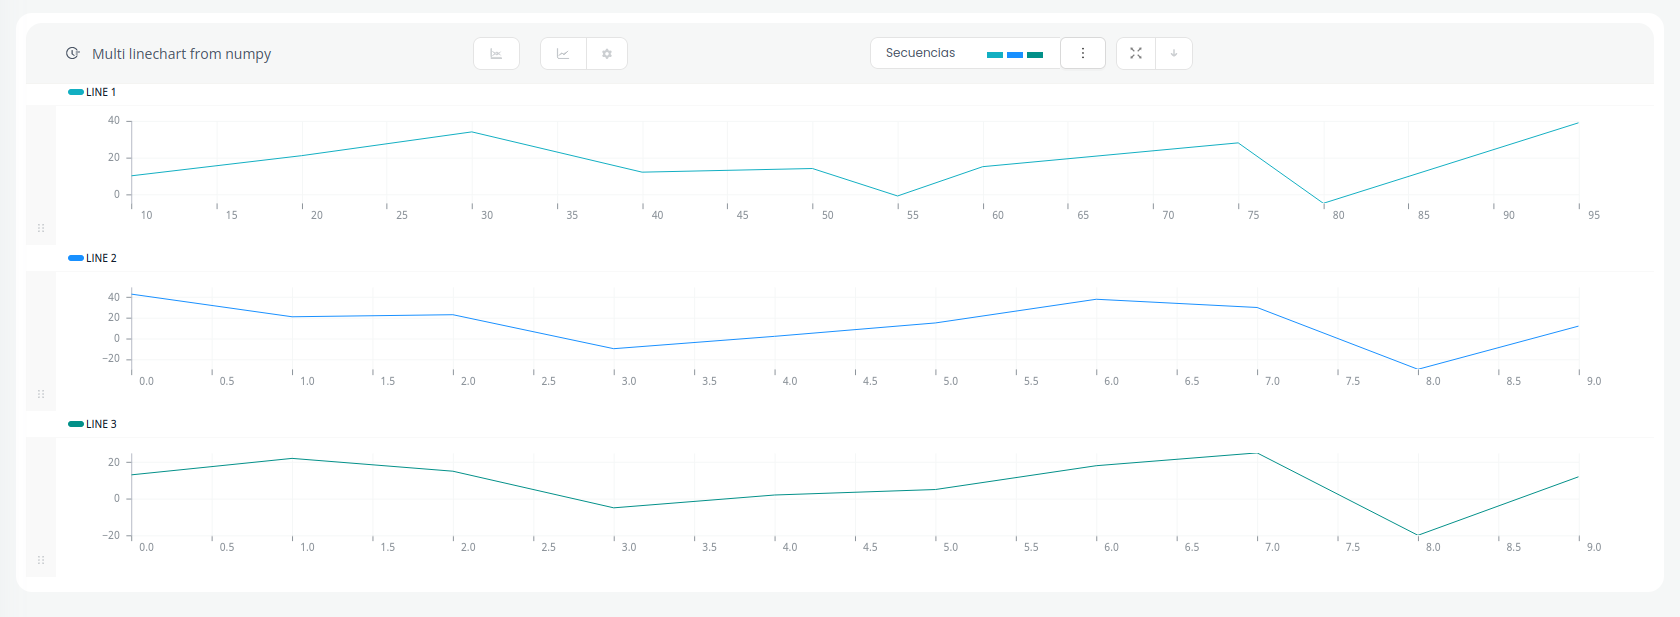
You can create a line chart or multiline chart using numpy using plot().
>>> # Numpy Arrays
>>> x_axis = np.array([10, 20, 30, 40, 50, 55, 60, 75, 80, 95])
>>> y_axis = np.array([10, 21, 34, 12, 14, -1, 15, 28, -5, 39])
>>> y_axis2 = np.array([43, 21, 23, -10, 2, 15, 38, 30, -30, 12])
>>> y_axis3 = np.array([13, 22, 15, -5, 2, 5, 18, 25, -20, 12])
>>>
>>> line_chart = app.line_chart(title="Multi line chart from numpy")
>>>
>>> line_chart.plot(y_axis, x_axis=x_axis, label="Line 1", lane_index=0)
>>> line_chart.plot(y_axis2, label="Line 2", lane_index=1)
>>> line_chart.plot(y_axis3, label="Line 3", lane_index=2)
Bind compatibility
You can bind this widget with this:
Bindable as
You can bind this widget as:
Currently this widget cannot be used as input in a binding function.