Data Apps
Shapelets Data Apps API allows you to create professional, interactive visualizations in a simple way, letting you focus only on what’s important, the data. As a Data Scientist it is very common to create dashboards or reports to show information or the results of a computation. But good visualizations usually bring more things to worry about, such as: deployment, availability, security, access control, etc… With Shapelets Data Apps you only have to develop the visualization you need using Python, and we take care of the rest.
In this section you will understand how data apps are built and how they work.
What is a Data App?
A Data App is basically a web application consisting of a composition of widgets or visualization components such as charts, buttons, selectors, etc. Although data apps are HTML applications, they are defined using Python code, which determines their properties (e.g. name, version number), the widgets they contain and the relationships between these widgets. Widgets may be interactive, meaning that the user may modify their state through the browser and these interactions can be used to trigger a computation in the server, to change of state of other widgets or both things. For example, a user may write a data app that starts a computation in the server every time a selector is changed or a button is clicked. In summary, each data app consists of a unique set of widgets and the desired interactions between them. Once the user defines all of this using the Python API, the data app can be registered, which means that it is stored in the server and made available for users to use the web application.
How to build a Data App?
Let’s write the code for your first data app, a simple data app displaying a “Hello World” text.
First, create a Python script and name it my_first_datapp.py for example.
The elements to create a data app are:
-
Data App object: You need to import the library and create a
dataAppobject.from shapelets.apps import dataApp
# Create a dataApp object
app = dataApp()
app.title(text="Demo") -
All the needed stuff: Here you create your functions, import your data, create your charts, …
-
Run the Data App: Locally run your Data App with the following terminal command:
dataApps run my_first_datapp.py --port 5000
Now, go to http://localhost:5000, and check out the Data App.
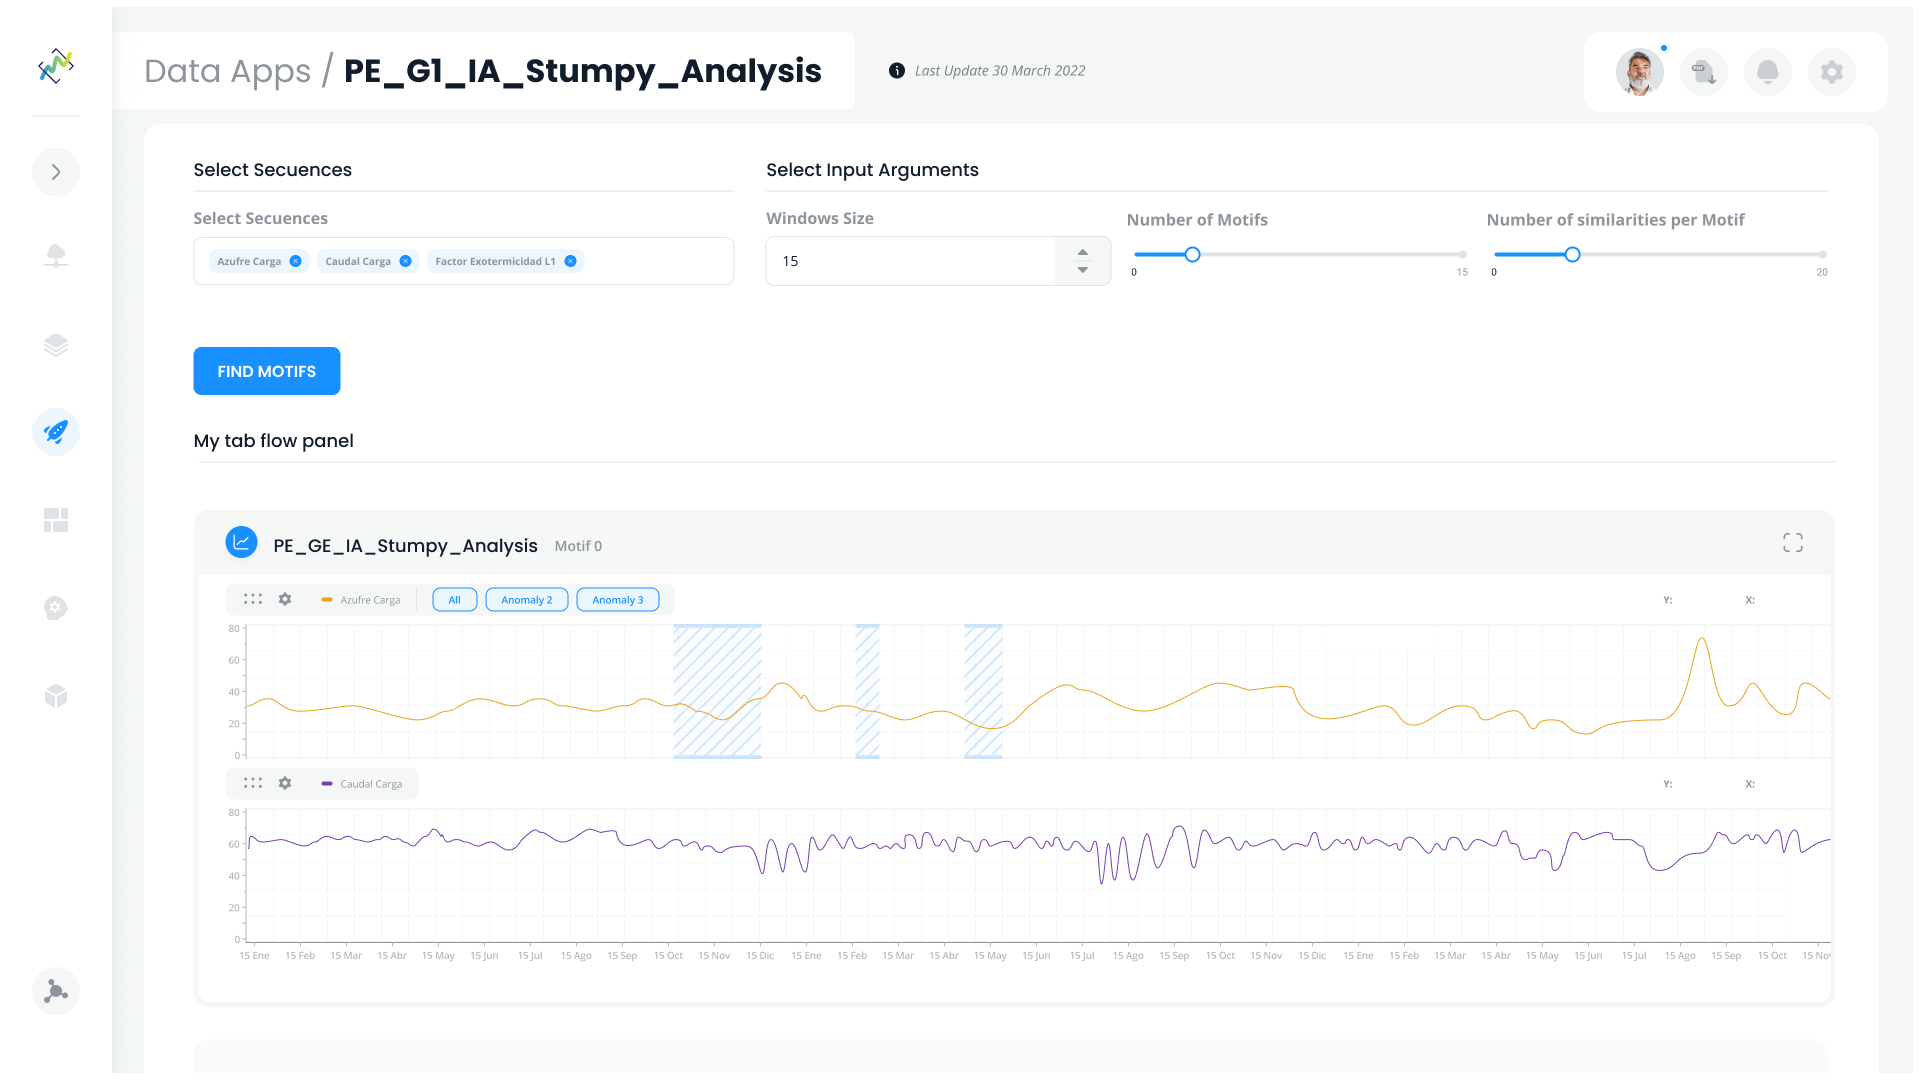
Widgets & Data App components
To create Data Apps, Shapelets provides a wide variety of visual components that you can compose and embed in Data Apps to create powerful interactive visualizations. We call it Widgets, and you can take a look at them here.
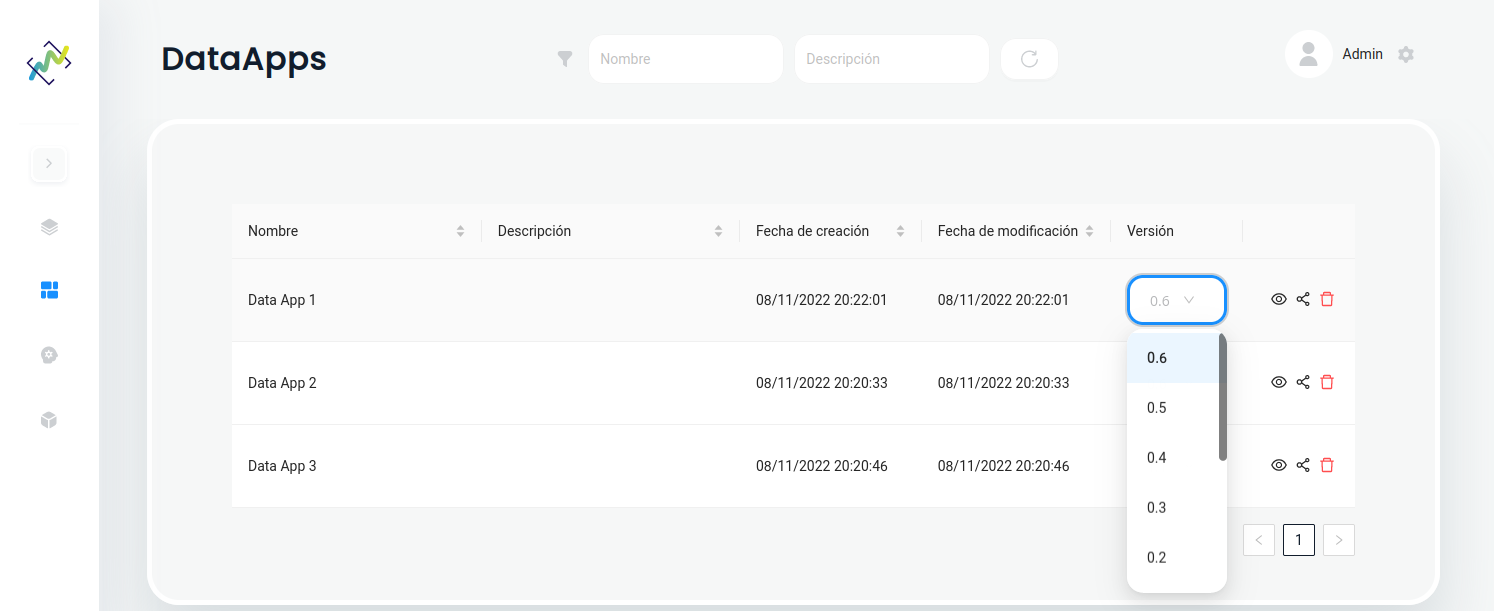
Version Control
At Shapelets we care a lot about changes in production versions, that’s why Shapelets incorporates its own version manager within its system to be able to re-run a previous version of your Data App with a single click.
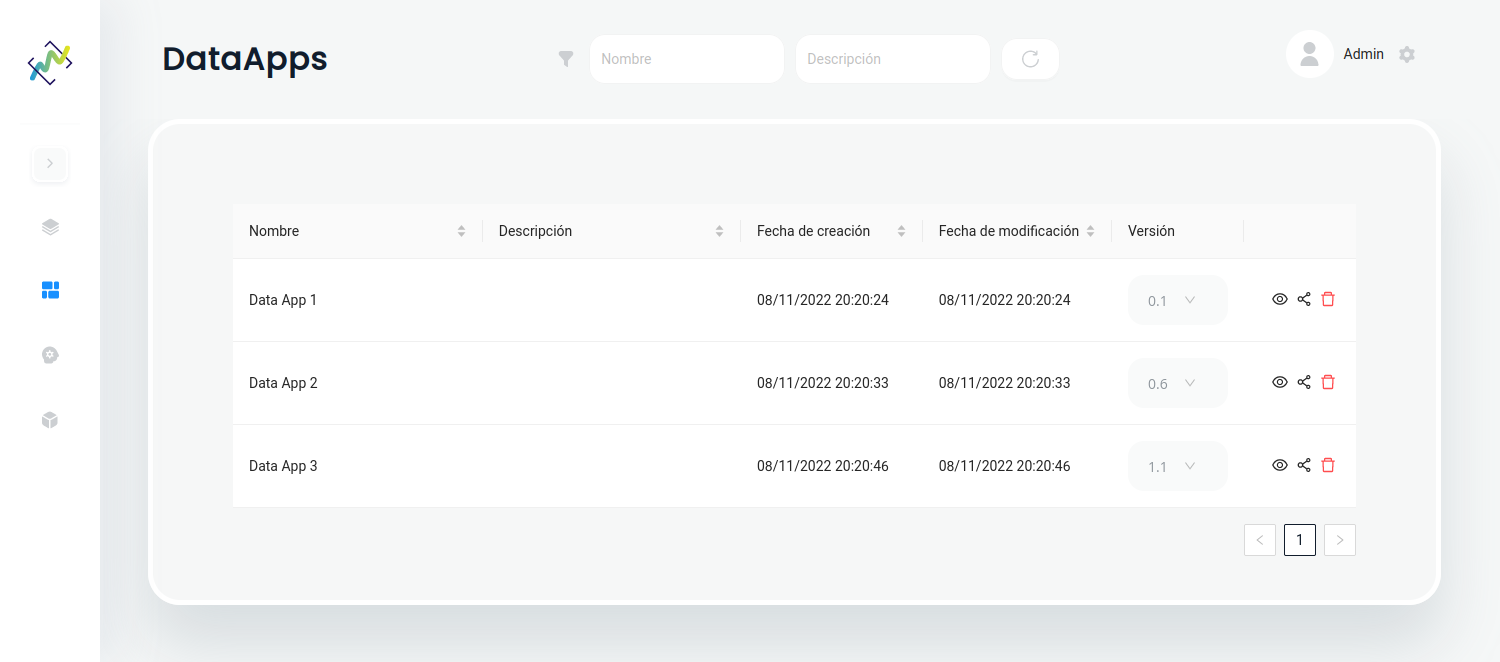
As you can see below, there is a column called “Version” which has a drop-down menu. By default, Shapelets is set to start the latest version of your Data App, but if you click on that menu you can select an older version and run it.
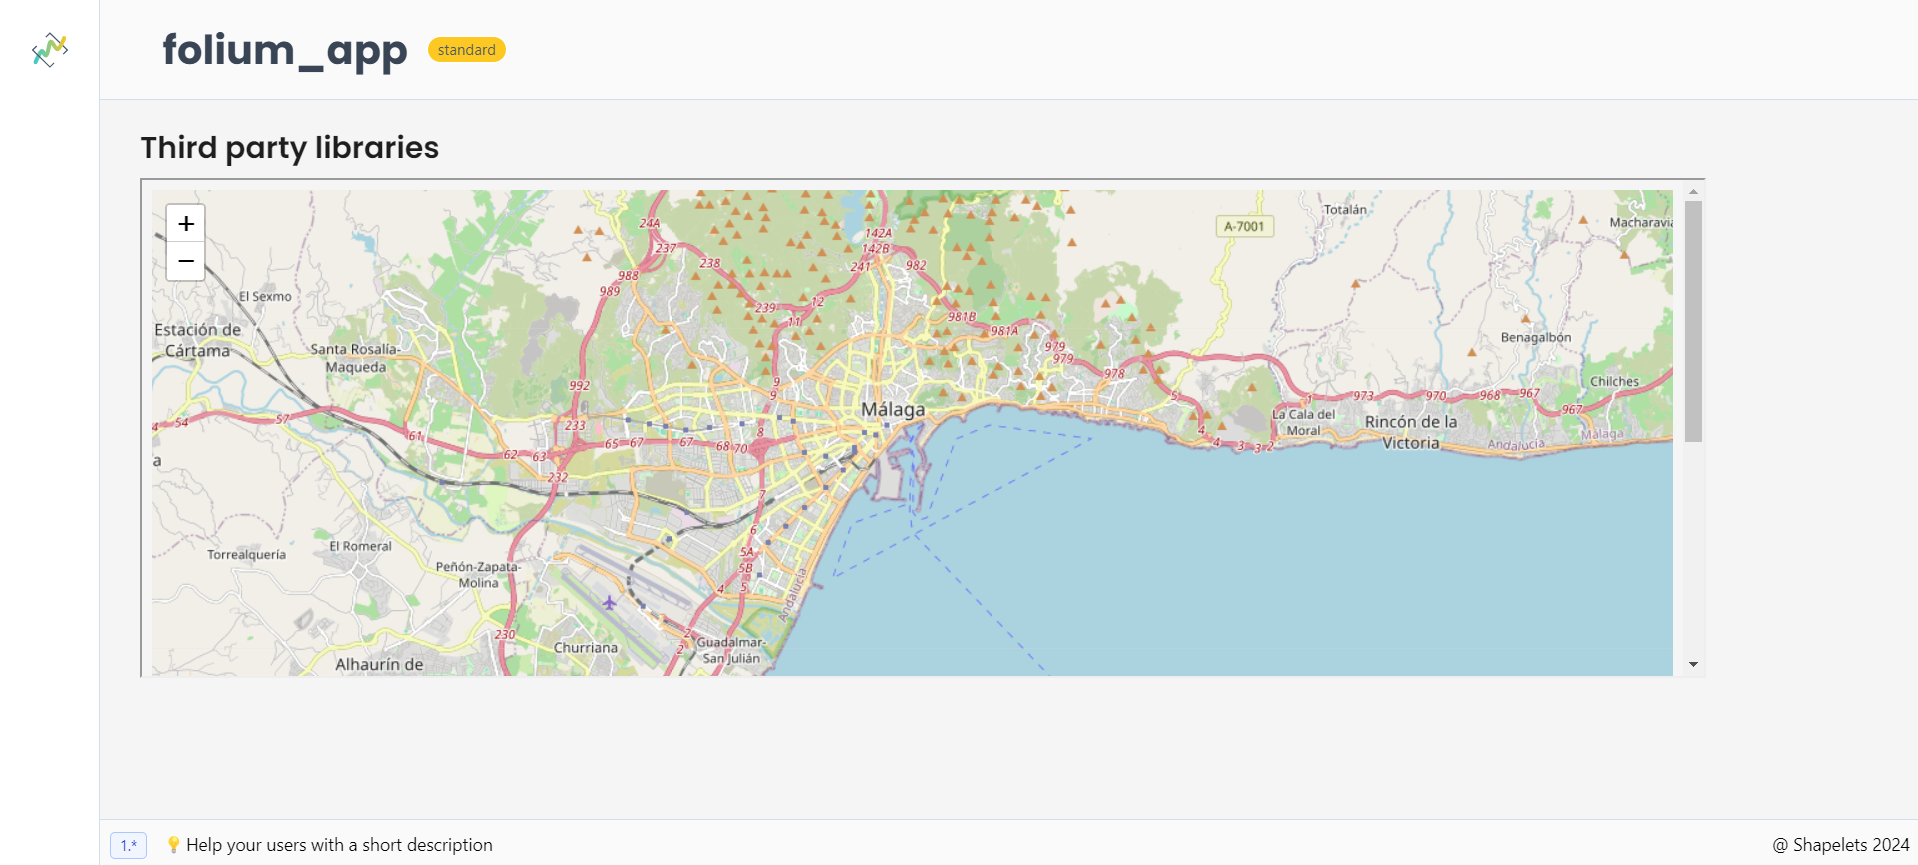
Integration with third-party libraries
If you have your own library to create charts or plot results, you can use it with Shapelets. Shapelets can run all visualization frameworks available in Python like Matplotlib, Folium, Altair, etc.
Let’s show an example of this with a simple Python script folium_app.py:
Folium
import folium

from shapelets.apps import dataApp

# Instantiate dataApp object
app = dataApp()
app.title(text="Third party library")

# Create basic folium map
folium_map = folium.Map(location=[36.669096, -4.416468], zoom_start=12)

# Obtain its HTML code and display the map
json_folium = folium_map._repr_html_()
app.foliumchart(
    title="Basic Folium Map",
    spec=json_folium,
    cssStyles={"width": "90%", "height": "400px"}
)
We then run the following command:
dataApps run folium_app.py