Data Apps#
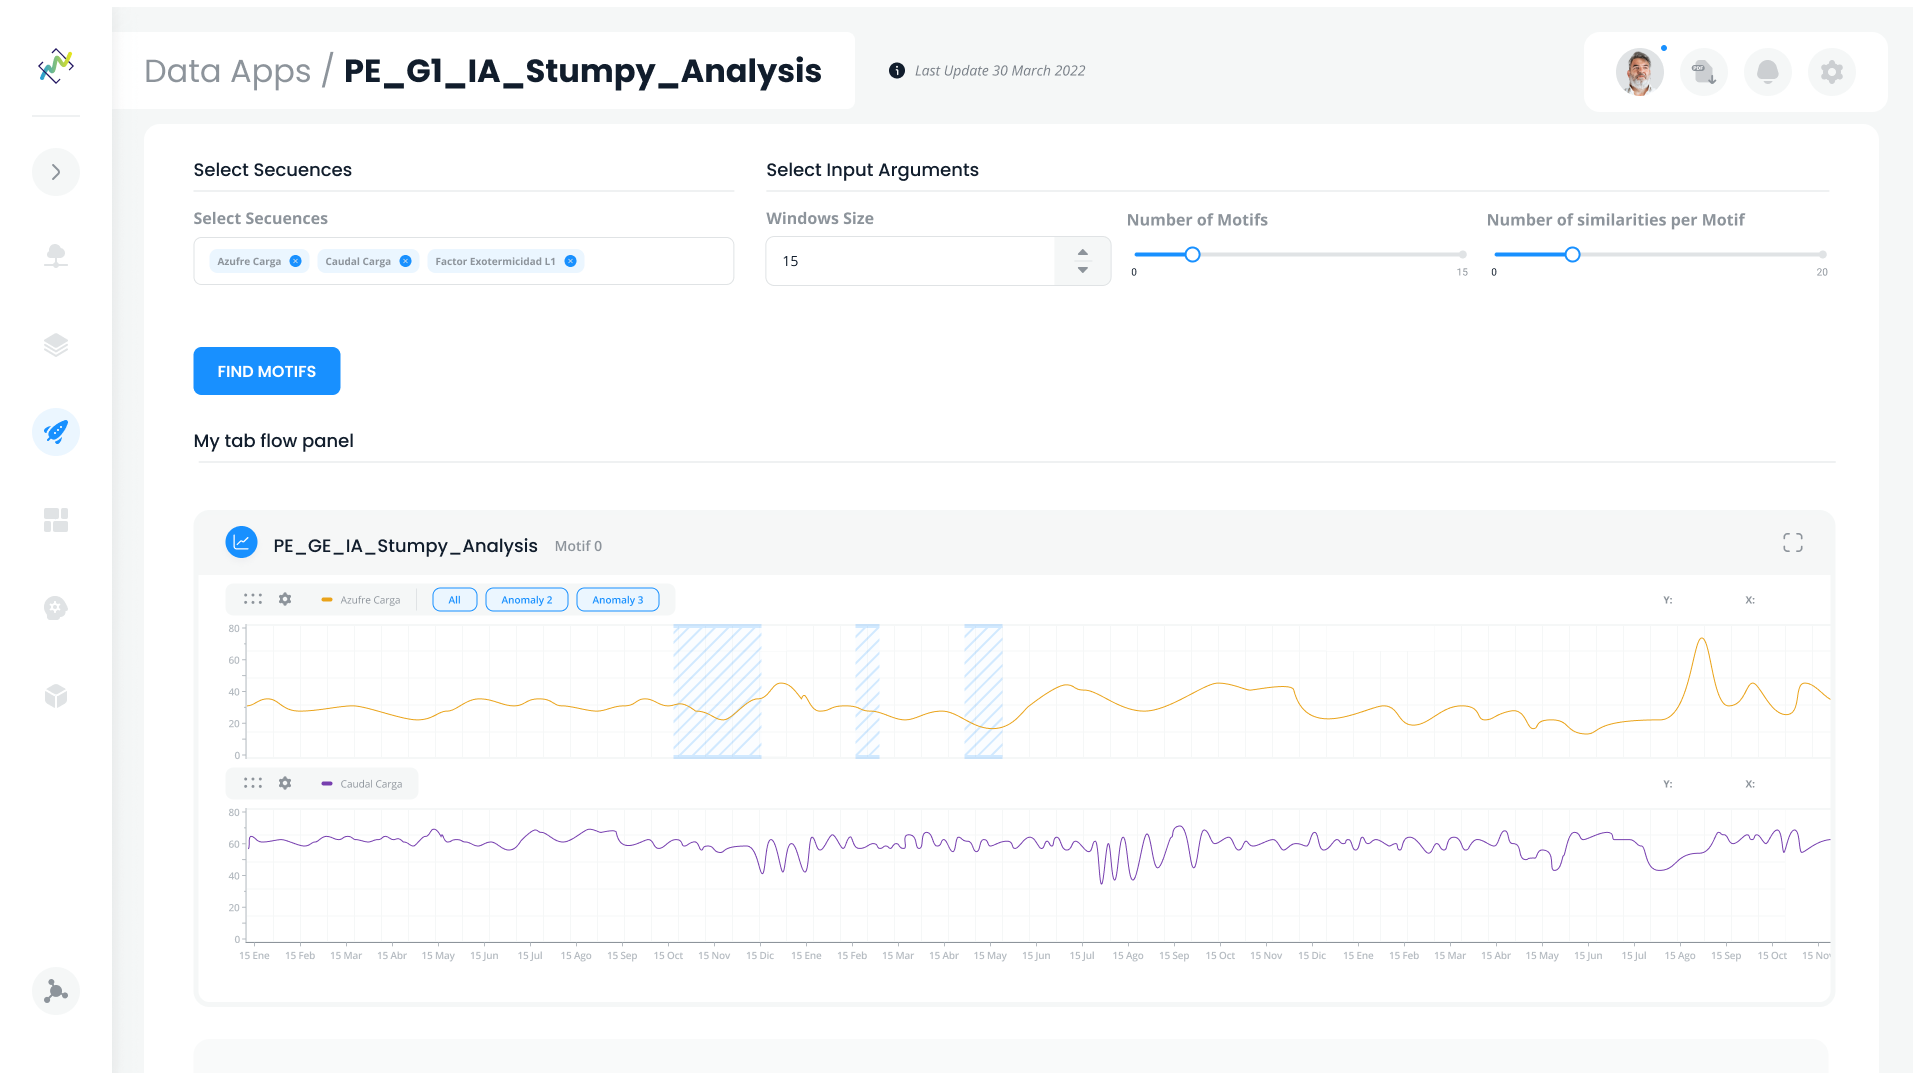
Shapelets’ API allows you to create professional, interactive visualizations in a simple way, letting you focus only on what’s important, the data. As a data scientist it is very common to create dashboards or reports to show information or the results of a computation. But good visualizations usually bring more things to worry about, such as: deployment, availability, security, access control, etc… With Shapelets API you only have to develop the visualization you need using Python, and we take care of the rest.
In this section you will understand how data apps are built and how they work.
What is a Data App#
A data app is basically a web application consisting of a composition of widgets or visualization components such as charts, buttons, selectors, etc. Although data apps are HTML applications, they are defined using Python code, which determines their properties (e.g. name, version number), the widgets they contain and the relationships between these widgets. Widgets may be interactive, meaning that the user may modify their state through the browser and these interactions can be used to trigger a computation in the server, to change of state of other widgets or both things. For example, a user may write a data app that starts a computation in the server every time a selector is changed or a button is clicked. In summary, each data app consists of a unique set of widgets and the desired interactions between them. Once the user defines all of this using the python API, the data app can be registered, which means that it is stored in the server and made available for users to use the web application.
How to build a data app#
Let’s write the code for your first data app, a simple data app displaying a “Hello World” text.
First, create a Python script and name it my_first_datapp.py for example.
The elements to create a data app are:
The session. You need to import the library and create a DataApp object.
>>> from shapelets.apps import DataApp
>>> # Create a data app
>>> app = DataApp(name="my_first_dataapp")
All the needed stuff. Here you create your functions, import your data, create your charts, …
Registry on platform. The final line on your data app must be the register function to make the data app available in the system.
>>> app.register()
Once we have written the code for the data app, how can we visualize it? We only need to execute the script we just created.
>>> python my_first_dataapp.py
Now, go to http://localhost:4567, login into the platform with your credentials and check out the data app.
Register a Data App#
When you have developed a Data App what you have to do is to register it in the system. You can do this by simply running the python script containing the Data App.
>>> python my_dataapp.py
Shapelets incorporates a code checker to check that you are not registering a dataapp with syntax errors in the code. When you run the python script, you will see that a file called errorLog_register.txt is created containing information about possible errors or warnings in your code.
Note
Not forget to add app.register() at the end of the script.
Widgets & Data App components#
To create data apps, Shapelets provides a wide variety of visual components that you can compose and embed in data apps to create powerful interactive visualizations. We call it Widgets, let’s take a look.
Version Control#
Shapelets’ Version Control feature easily tracks and manages changes, allowing Data Scientists to focus solely on improving and adjusting their data apps. Our Version Control registers all versions and allows the user to work on any of them, even if later versions are available. It allows for a smooth and continuous flow of changes.
You can find out more about version control here.
Integration with third-party libraries#
If you have your own library to create charts or plot results, you can use it with Shapelets. Shapelets can run all visualization frameworks available in Python like Matplotlib, Folium, Altair, etc.
Let’s show some examples of this:
Altair#
>>> from shapelets.apps import DataApp
>>> import altair as alt
>>> import pandas as pd
>>>
>>> app = DataApp(name="altair example")
>>>
>>> source = data.cars()
>>>
>>> spec = alt.Chart(source).mark_circle(size=60).encode(
>>>     x='Horsepower',
>>>     y='Miles_per_Gallon',
>>>     color='Origin',
>>>     tooltip=['Name', 'Origin', 'Horsepower', 'Miles_per_Gallon']
>>> ).interactive()
>>> altair_chart = app.altair_chart(title='Altair Chart 2', spec=spec)
>>> app.place(altair_chart)
>>>
>>> app.register()
Folium#
>>> import folium
>>> from shapelets.apps import DataApp
>>>
>>> app = DataApp(name="folium example")
>>>
>>> m = folium.Map(location=[45.5236, -122.6750])
>>>
>>> folium_chart = app.folium_chart(title='Folium Map', folium=m)
>>> app.place(folium_chart)
>>>
>>> app.register()