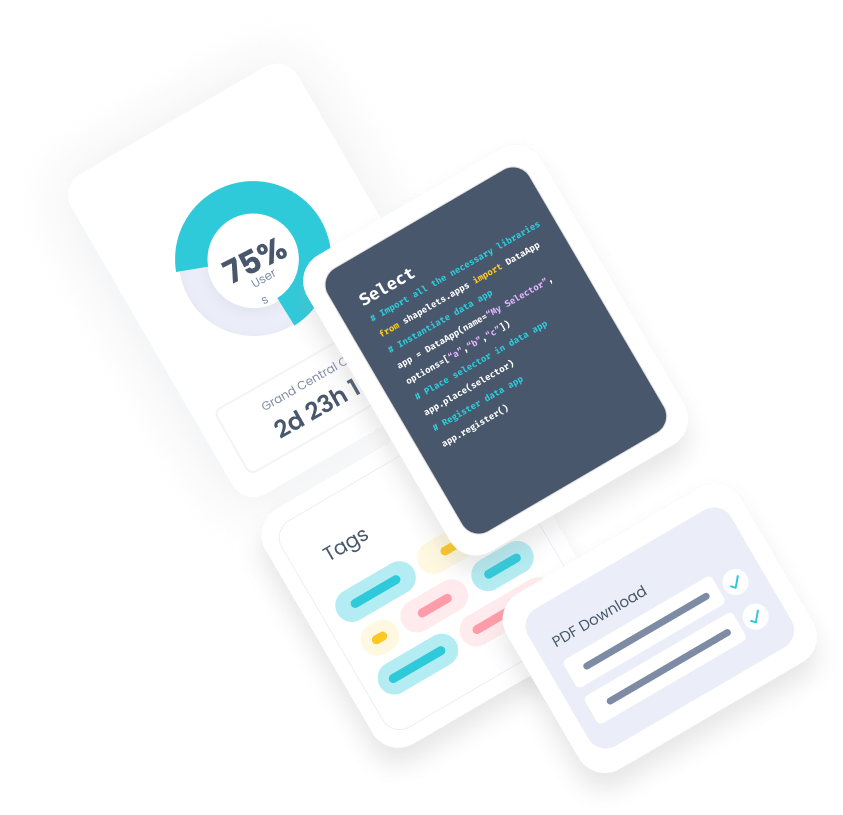
Powerful interactive data visualizations
Interactive Visualizations
Python-based dashboards and data apps
Use our python API to develop professional visualizations in seconds, with server-side processing that scales horizontally to support data visualization at scale and multiple concurrent users.
Integrate visualizations from Altair, Vega, E-Charts and Mosaic, among others, and use them to fluently navigate through charts with millions of data points.
Building the right visualizations takes too much time?
Current tools hinder collaboration between data professionals and business stakeholders.
Shapelets Data Apps brings in a single python package all the tools that your organization needs to develop agile data projects.
Take data projects to production 2x faster by developing them collaboratively with Shapelets Data Apps.
Challenges in data-related projects
Are you or your company experiencing any of these issues?
ARCHITECTURE
Improved creation of custom data apps and the ability to create dashboards to help you share your visualizations in an easier and fast way.
Designed to handle data in multiple formats and fully interoperable with Arrow, Pandas and Polars.
Create charts out of millions of data rows with extremely smooth and responsive interactivity.
Share your data insights and visualizations immediately and safely with other users in your organization.
Interactive Visualizations
A powerful Python API to instantly create and share interactive visualizations.
Make your data insights unforgettable
Shapelets Data Apps acts as a server application that provides access to the data and data visualizations (data apps) through a browser (client). These data apps or web applications contain widgets that can be used to interact with data attached to the data app and to select parameterizations and trigger computations in the server/cluster based on the selected parameters.
We have enhanced the interactive visualization features to make it easy for a data scientist to create clear, simple, and intuitive data apps. It allows data teams to get a better understanding of the data, manage multiple scenarios and keep track of them. No need for third-party tools or a front-end team to build advanced, professional visualizations.
Quick access to all the controls you need, exactly when you need them. It is easier and richer than ever
Load
All data apps come with a “sandbox” where you can instantly load files at scale in various formats like CSV, arrow, parquet and feather.
Our smart data engine does not need to load all the data in memory directly, but will just load the data that is required to execute queries, accelerating your analysis and visualizations while minimizing memory footprint.
Transform
Build and concatenate queries using standard SQL language.
Our query engine allows for lazy evaluations, reading just the required data to execute a given query and triggering computations only after a query chain is executed. This approach reduces significantly the usage of resources, avoiding unnecessary computations and improving efficiency and response times.
Visualize
Build beautiful, interactive visualizations using our python API to instantly communicate insights to business users.
Visualization updates can be published immediately and incorporate version control to ensure older data applications can be restored if needed. Our data apps are compatible with some of the most relevant visualization libraries in Python’s ecosystem like Vega, Altair, E-Charts and Mosaic, using them in combination with an efficient data engine will allow you to quickly explore and navigate through million-point datasets.
Want to apply Shapelets to your projects?
Contact us and let us study your case.
Shapelets Data Apps: Agile data analytics
Reduce the time to production of data applications from weeks to minutes.
Data professionals can use python to quickly create professional and interactive data visualizations. These visualizations can be immediately made
available for specific business users to consume them in a platform deployed in your corporate environment, with version control for incremental
development.
Visualize data regardless of its source or size.
Use charts from popular python libraries to create your own visualizations.
Use our linecharts to explore and navigate through large time series
Serve many users maintaining low TCOs
Direct your data apps towards specific users or groups within your organization.
Recover and reuse any old visualization.
Start building impressive data apps today
Try our python package and start creating your own interactive applications and dashboards. You set the limits.

Start building impressive data apps today
Try our python package and start creating your own interactive applications and dashboards. You set the limits.
