Folium
Allows users to create interactive maps using the Folium library.
Function signature
app.foliumchart(spec, title=None, on_change=None)
Parameters
| Parameter | Description |
|---|---|
| spec (Any) | The JSON / HTML specification of the Folium map to be shown. |
| title (str) | The title of the chart, shown above the Folium map. |
| on_change (FoliumChartOnChange) | Event handler called when the map's data or state changes. |
Example
The basic example below shows how to create a Folium map widget.
from shapelets.apps import FoliumChart, dataApp
import folium

# Set up Data App
app = dataApp()

# Set the title of the app
app.title('Folium Chart')

# Create a Folium map based on Continents
folium_Chart = folium.Map(location=[1.6508, 10.2679], zoom_start=3)

json_folium = folium_Chart._repr_html_()

# Add the FoliumChart to the app without on_change handler
app.foliumchart(
    title="Folium Map Chart",
    spec=json_folium,
    cssStyles={
        "width": "100%",
        "height": "600px",
    },
)
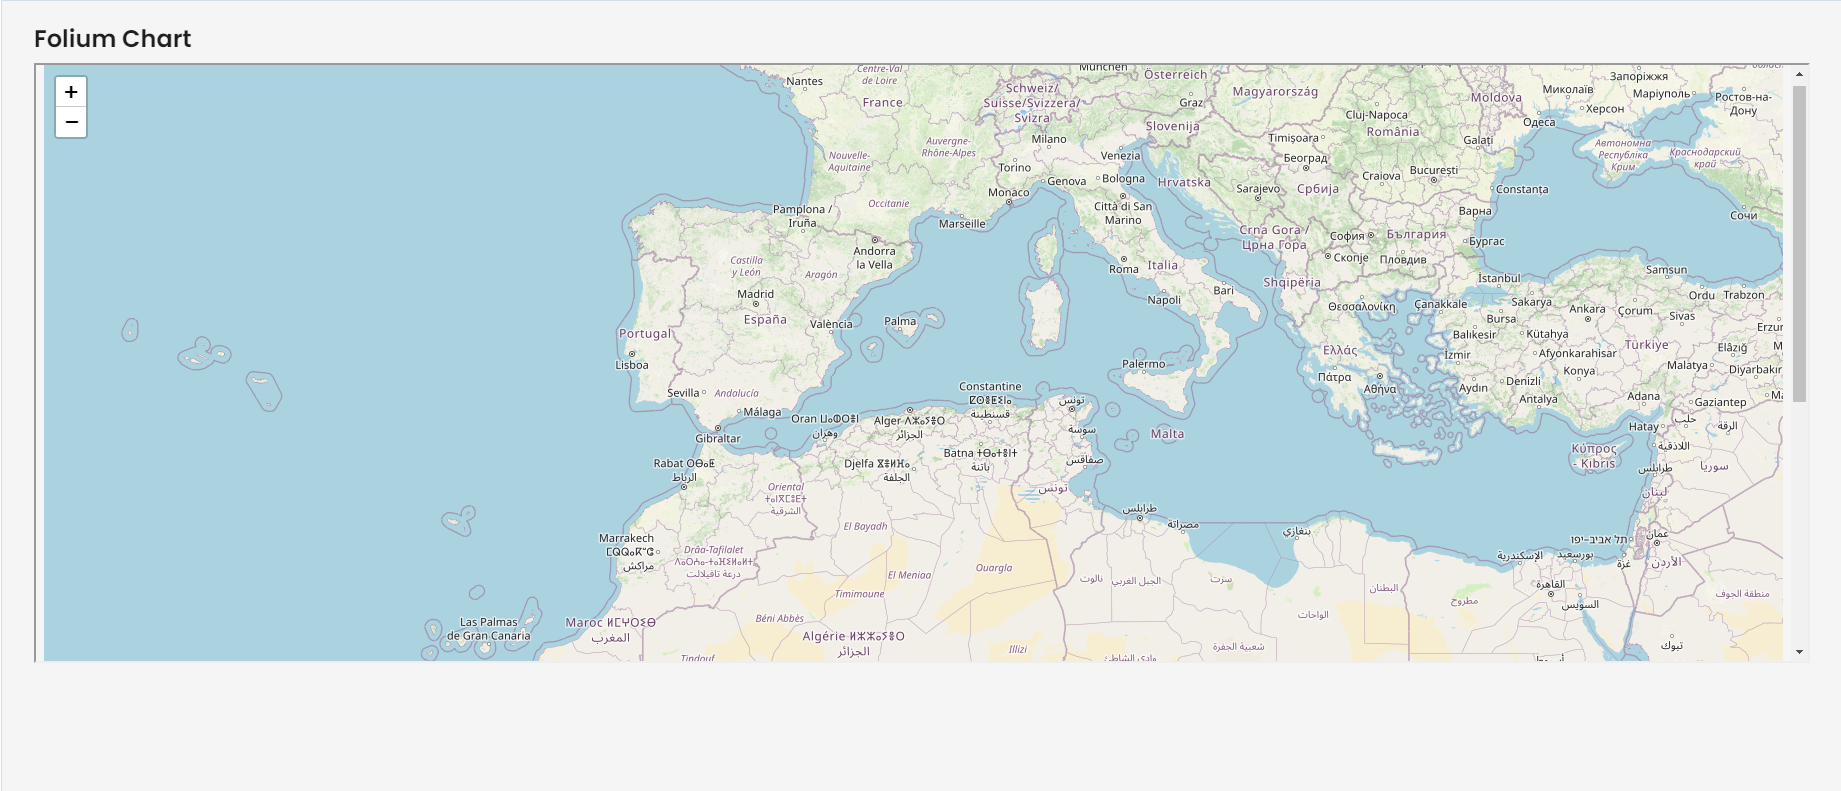
- The first image displays the global map on our dataApp and you can scroll up and down to view more additional spatial information.
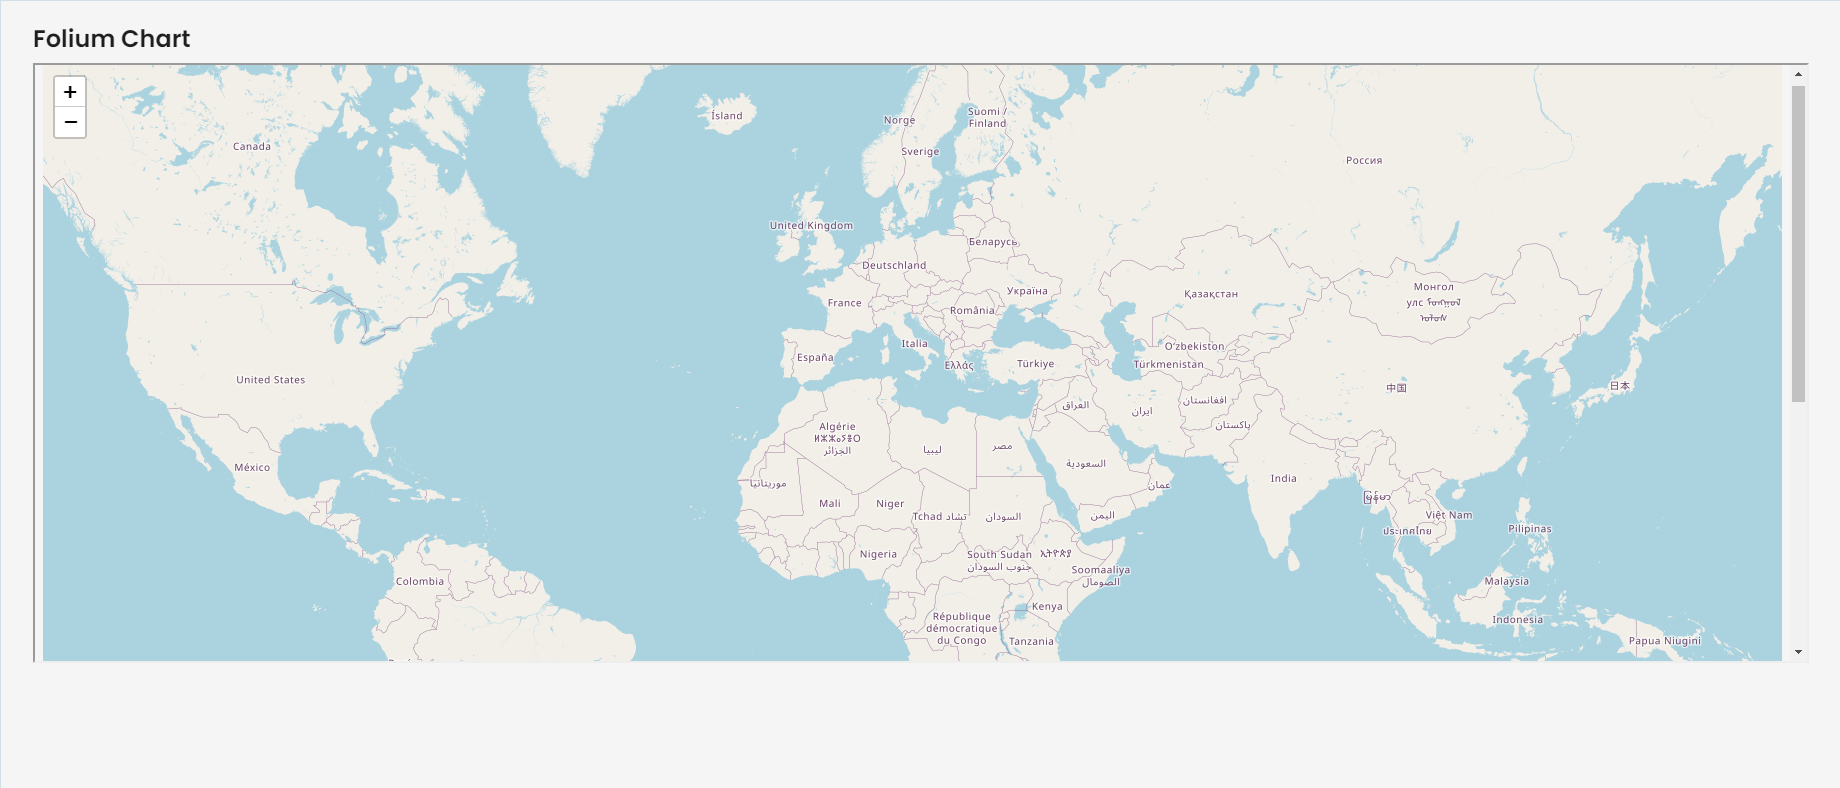
- The second image shows how pan and zoom effects can be explored using our widget in our dataApp.