Vega
Allows users to visualise interactive data plots using Vega.
Function signature
app.vegaChart(title=None, spec, cssStyles=None)
Parameters
| Parameter | Description |
|---|---|
| title (Optional[str]) | The title of the VegaChart widget, displayed above the chart. |
| spec (str) | The JSON specification of the Vega or Vega-Lite chart, typically generated by converting an Altair chart to JSON using the to_json() method. |
| cssStyles (Optional[dict]) | A dictionary specifying custom CSS styles to apply to the VegaChart widget, such as width, height, and other visual properties. |
Example
The example below shows how to create a VegaChart widget.
- Remember to pip install the vega_datasets and altair library.
from shapelets.apps import dataApp
from vega_datasets import data
import altair as alt
# Set up Data App
app = dataApp()
# Set the title of the app
app.title('Vega Chart Example')
# Load the 'cars' dataset
cars = data.cars()
# Create a scatter plot
chart = alt.Chart(cars).mark_circle(size=60).encode(
x='Horsepower',
y='Miles_per_Gallon',
color='Origin',
tooltip=['Name', 'Horsepower', 'Miles_per_Gallon']
).interactive()
# Convert the Altair chart --> JSON for Vega specification
json_vega = chart.to_json()
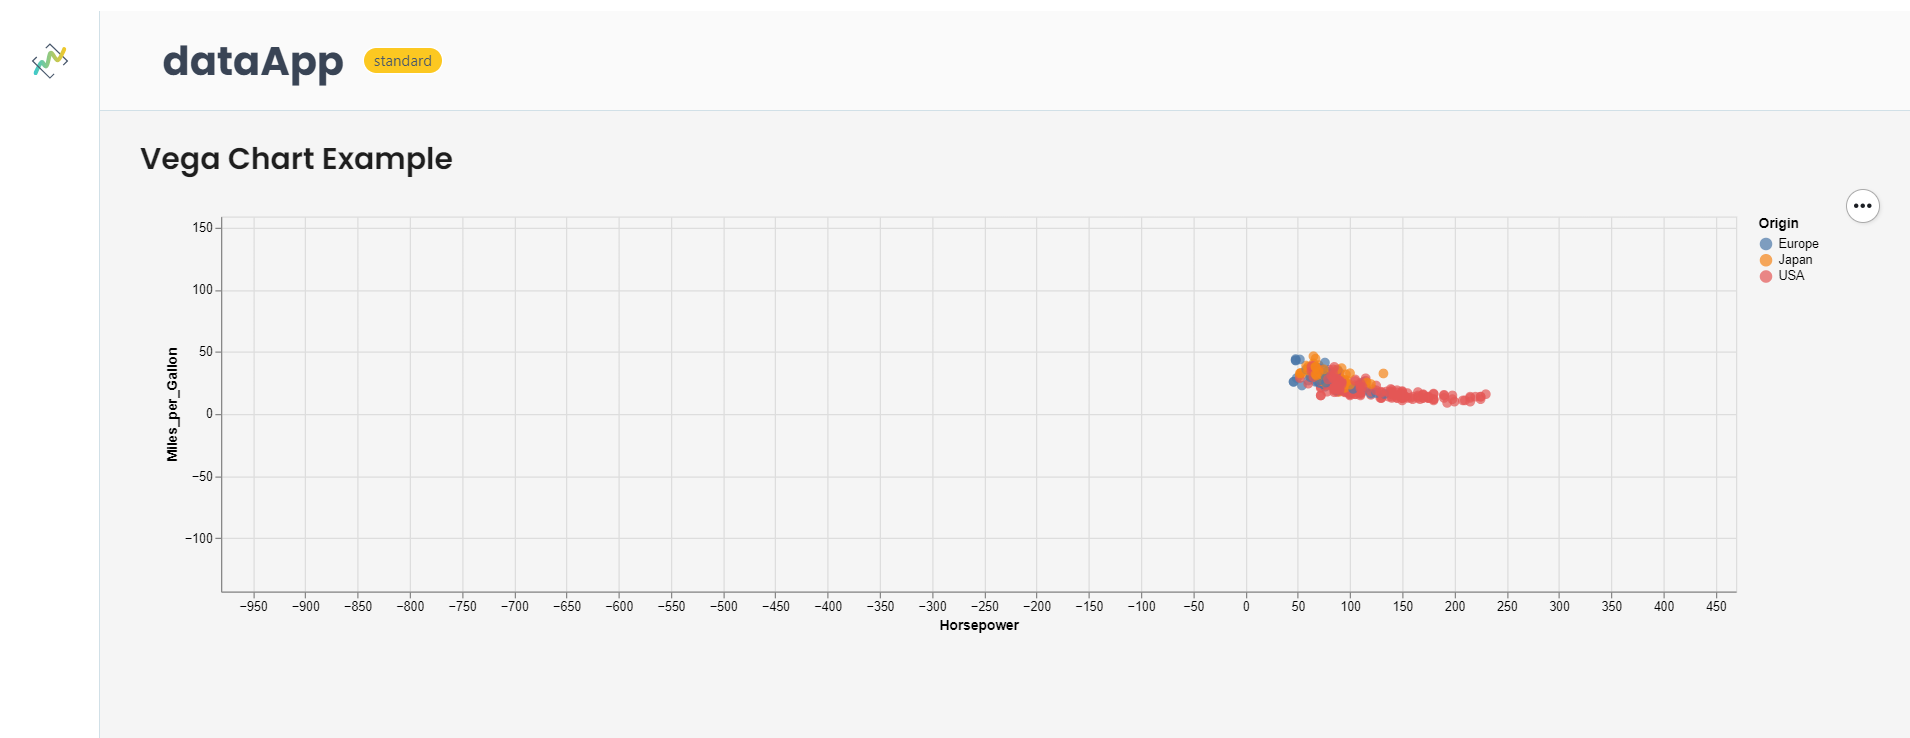
app.vegaChart(title='Scatter plot', spec=json_vega)
- The first image is a compact version of the VegaChart widget in our dataApp.
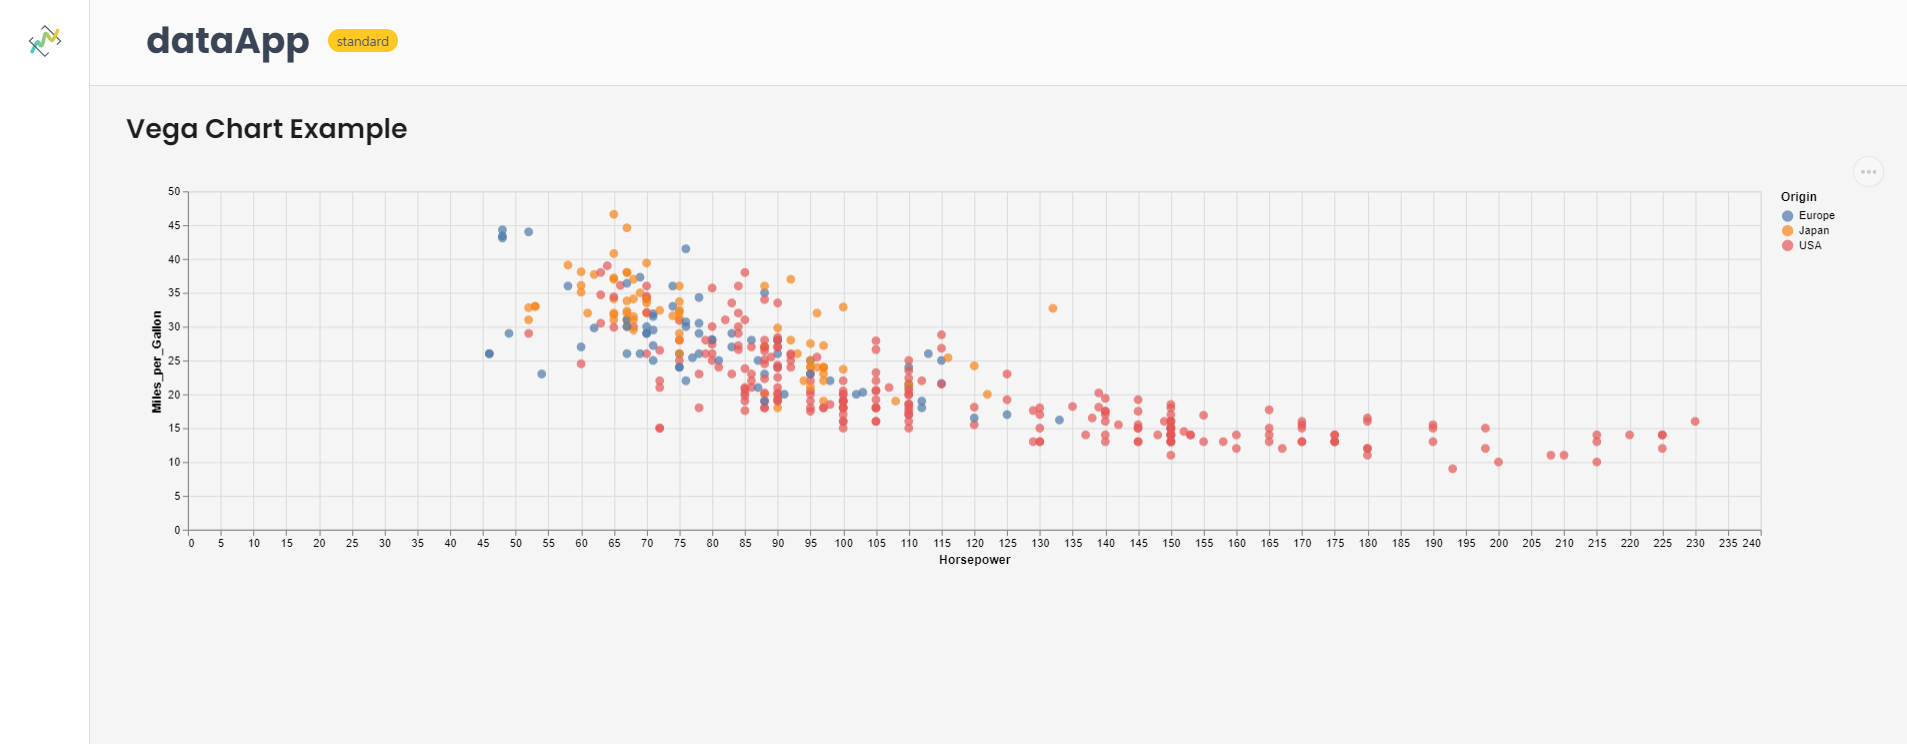
- The second image shows how intuitive the VegaChart widget can be in our dataApp.