Transforms
Allows users to apply a transformation to the data.
🔗 Explore Transforms: Parameters and Descriptions
Examples
- All the examples below show the combined use of transforms and other components to create a complete visualization.
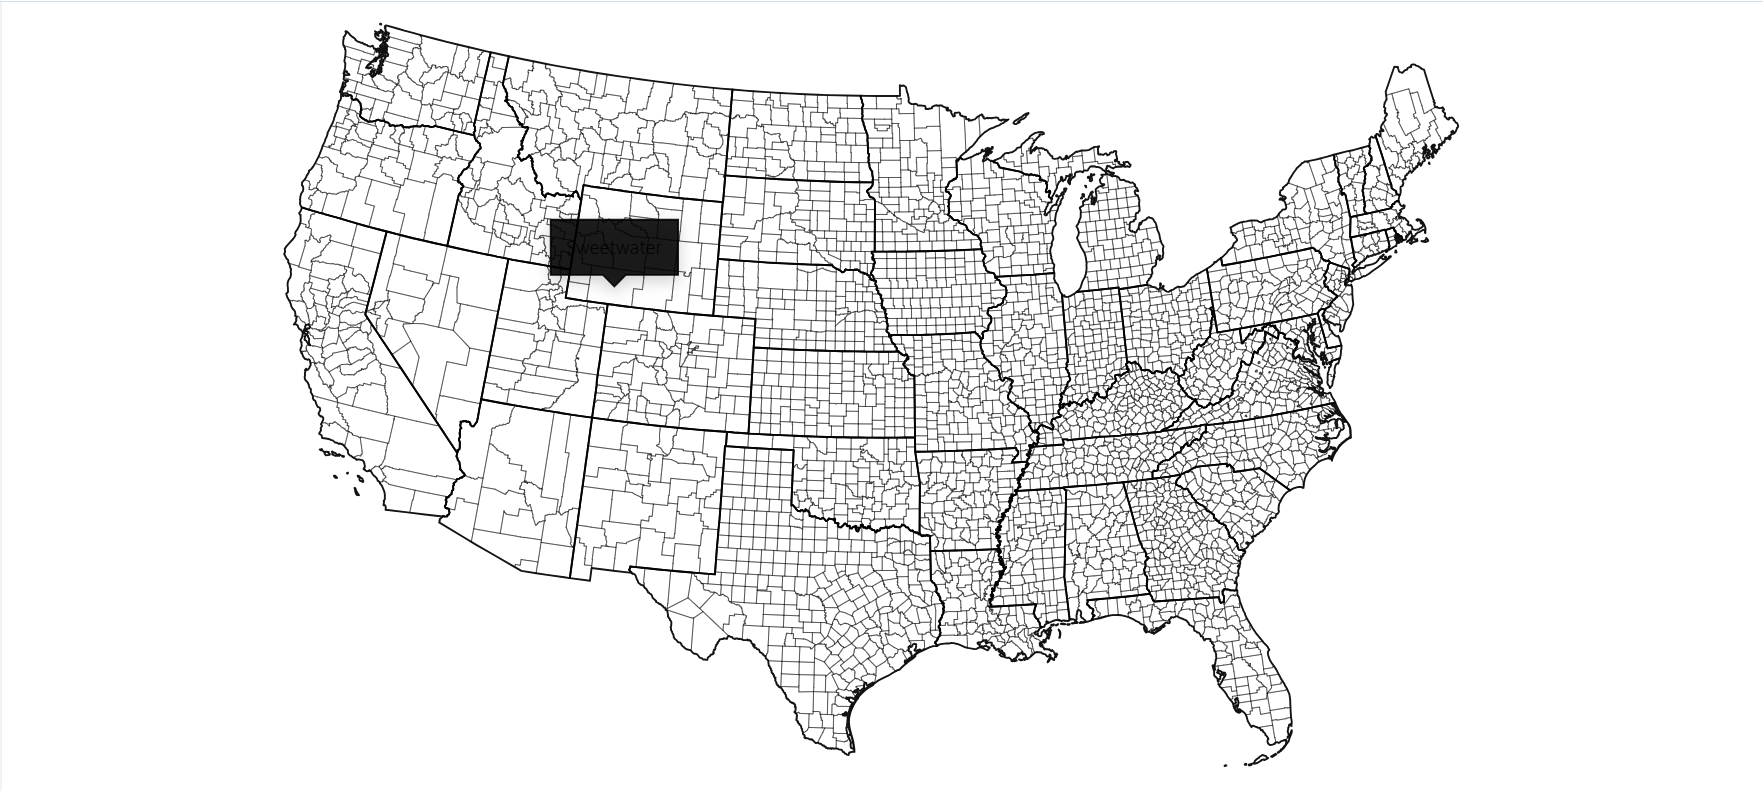
Example 1 : Using geo-spatial data to display the feature.
-
Using the feature below from transform module :
Centroid - Allows to compute the centroid X and Y coordinate.
from shapelets.apps import dataApp, vg

app = dataApp()

app.title('GeoJSON - US Country Map')

counties = app.sandbox.from_spatial('counties', 'us-counties-10m.json', layer='counties')
states = app.sandbox.from_spatial('states', 'us-counties-10m.json', layer='states')

app.mosaic(
    vg.layouts.vconcat(
        vg.plot(
            vg.marks.geo(counties, stroke='currentColor', strokeWidth=0.25),
            vg.marks.geo(states, stroke='currentColor', strokeWidth=1),
            vg.marks.dot(counties,
                         x=vg.transforms.centroidX('geom'),
                         y=vg.transforms.centroidY('geom'),
                         r=2,
                         fill='transparent',
                         tip=True,
                         title='name'),
            margin=0,
            projectionType='albers'
            width=800, height=400
        )
    )
)
