Mosaic
Allows users to create a mosaic plot or chart components.
app.mosaic
app.mosaic(top, height=None, width=None)
Parameters
| Parameter | Description |
|---|---|
| top (Component) | The top-level component that defines the structure and data of the mosaic plot. |
| height (Union[str, int]) | The height of the mosaic plot, specified as a string or integer. |
| width (Union[str, int]) | The width of the mosaic plot, specified as a string or integer. |
Quick Tip
- For the mosaic widget,
vg(visual graphics) module is used to create the visualisation.
Example
The example below shows how to leverage mosaic widget and create a data visualisation app that allows users to interact with the data.
Dataset
-
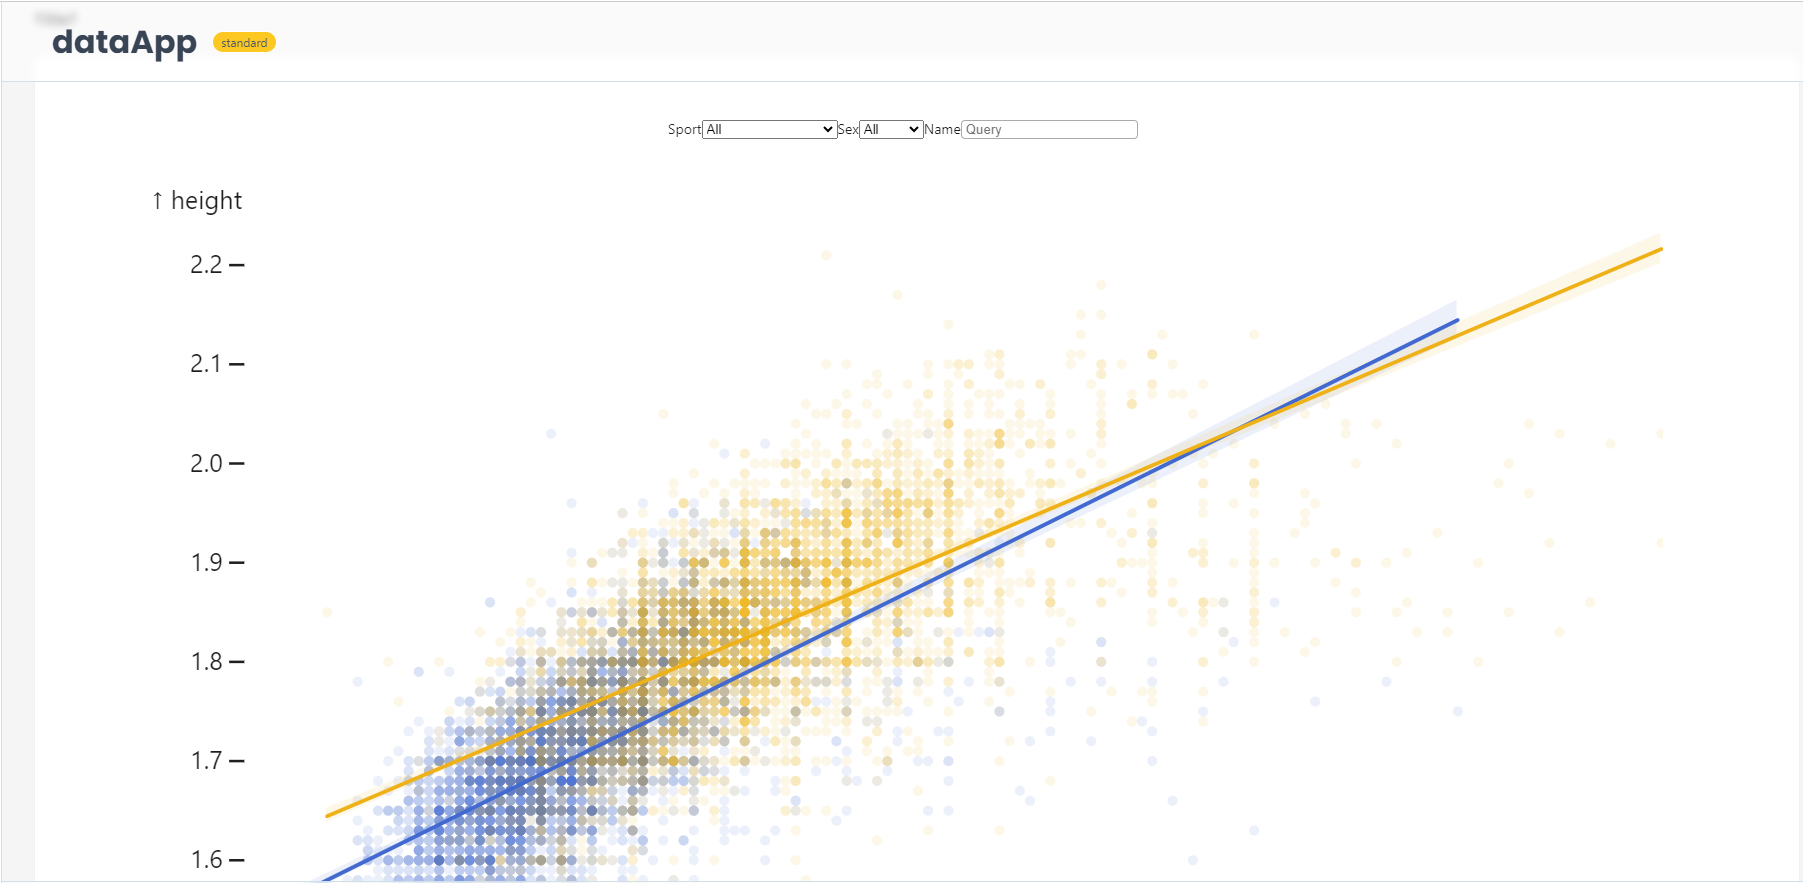
The app loads a dataset of athletes and displays a mosaic plot that shows the relationship between athelete's weight and height using the associated features in the dataset.
Data is available at Kaggle - Olympics: Athletes and Results.
-
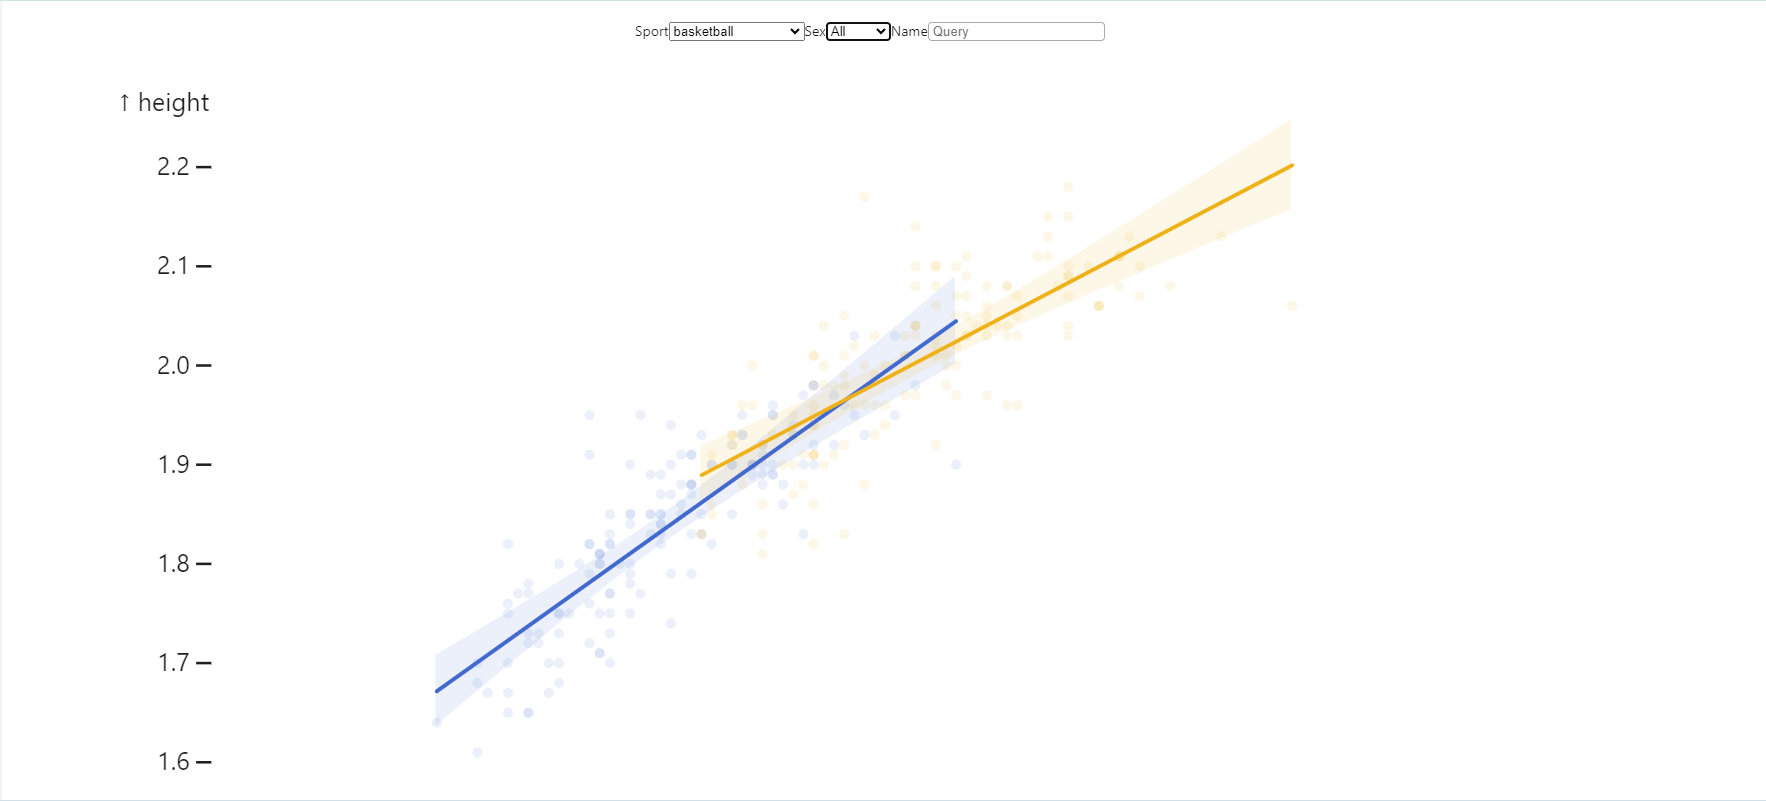
Users can filter the data by sport, sex and athlete name.
-
The app also displays a table that shows the details of the athletes.
# Import necessary libraries
# vg is the alias for shapelet.apps's visual graphics library
from shapelets.apps import dataApp, vg

# Set up Data App
app = dataApp()

# Set the title of the app
app.title("Athletes")

# Load the dataset using our sandbox.
athletes = app.sandbox.from_parquet("athletes", ["athletes.parquet"])

query = vg.params.intersect()

# Display the app layout in both plot and tabular format.
app.mosaic(
    vg.layouts.vconcat(
        vg.layouts.hconcat(
            vg.inputs.menu(label='Sport', as_=query, from_=athletes, column='sport'),
            vg.inputs.menu(label='Sex', as_=query, from_=athletes, column='sex'),
            vg.inputs.search(label='Name', as_=query, from_=athletes, column='name', type='contains')
        ),
        vg.layouts.vspace(10),
        vg.plot(
            vg.marks.dot(athletes, query, x='weight', y='height', fill='sex', r=2, opacity=0.1),
            vg.marks.regressionY(athletes, query, x='weight', y='height', stroke='sex'),
            vg.interactors.intervalXY(as_=query, brush={'fillOpacity': 0, 'stroke': 'black'}),
            xyDomain='Fixed',
            colorDomain='Fixed',
            margins={'left': 40, 'top': 20, 'right': 1},
            width=600,
            height=450
        ),
        vg.layouts.vspace(5),
        vg.inputs.table(
            from_=athletes,
            maxWidth=570,
            height=250,
            filterBy=query,
            columns=['name', 'nationality', 'sex', 'height', 'weight', 'sport'],
            width={'name': 180, 'nationality': 100, 'sex': 50, 'height': 50, 'weight': 50, 'sport': 100}
        )
    )
)
First Image
- Displays how the mosaic plot looks like when the app is run.

Second Image
- Displays the mosaic plot with the data and filters applied.

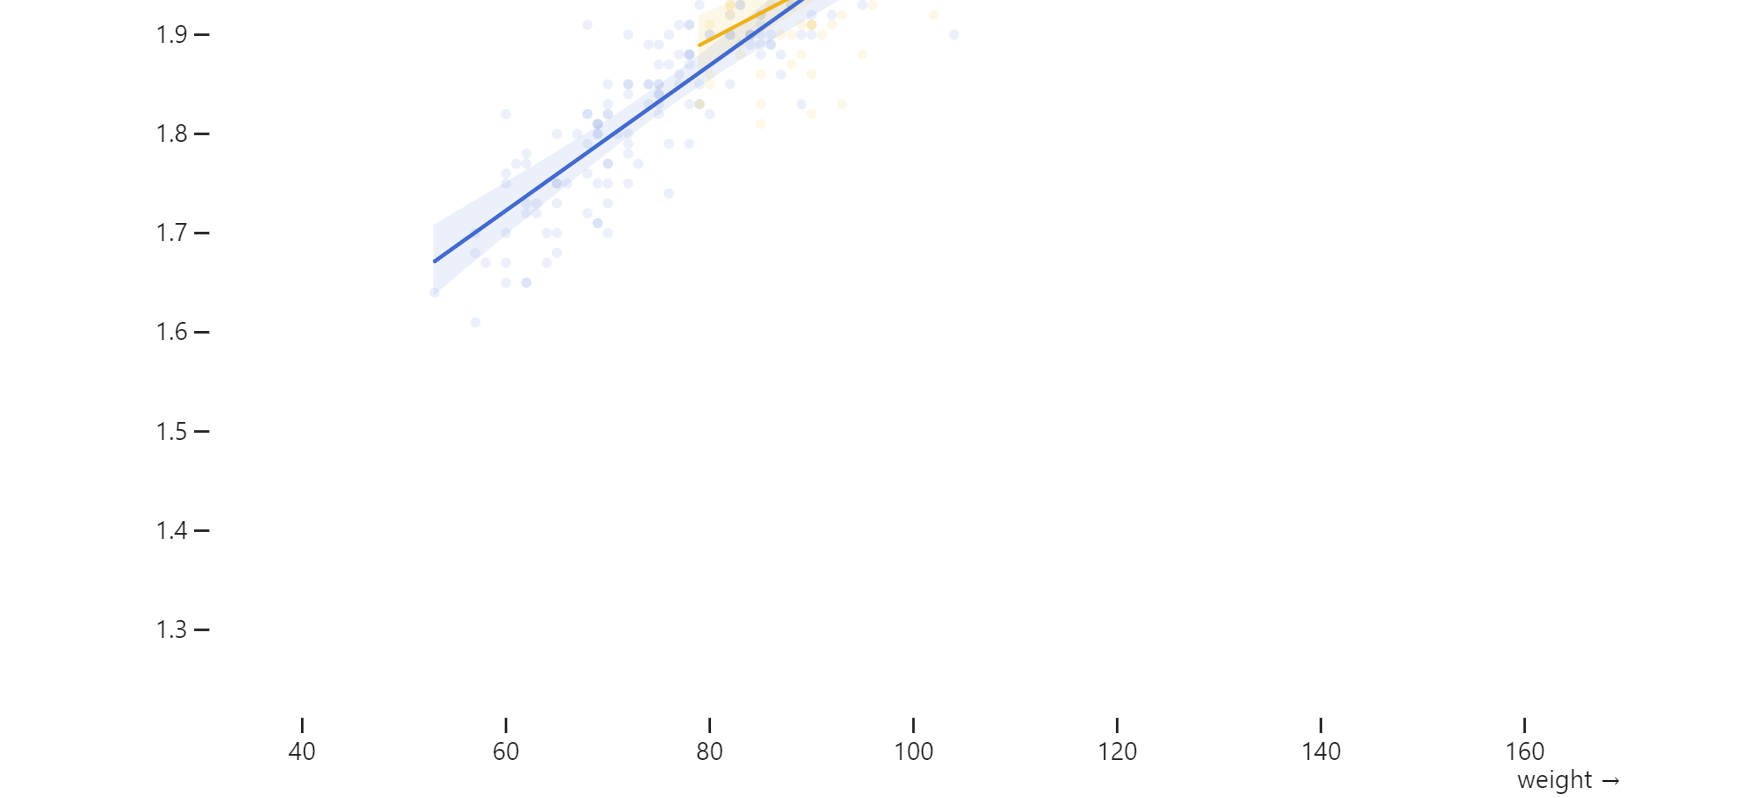
Third Image
- Displays the mosaic plot with the data and filters applied.
