Inputs
Allows users to handle input data for visualization.
For detailed information about the inputs component and its comprehensive features, check out the dedicated documentation page below:
🔗 Explore Inputs: Parameters and Descriptions
Examples
- All the examples below show the combined use of inputs and other components to create a complete visualization.
Example 1 : Using Menu
Dataset
-
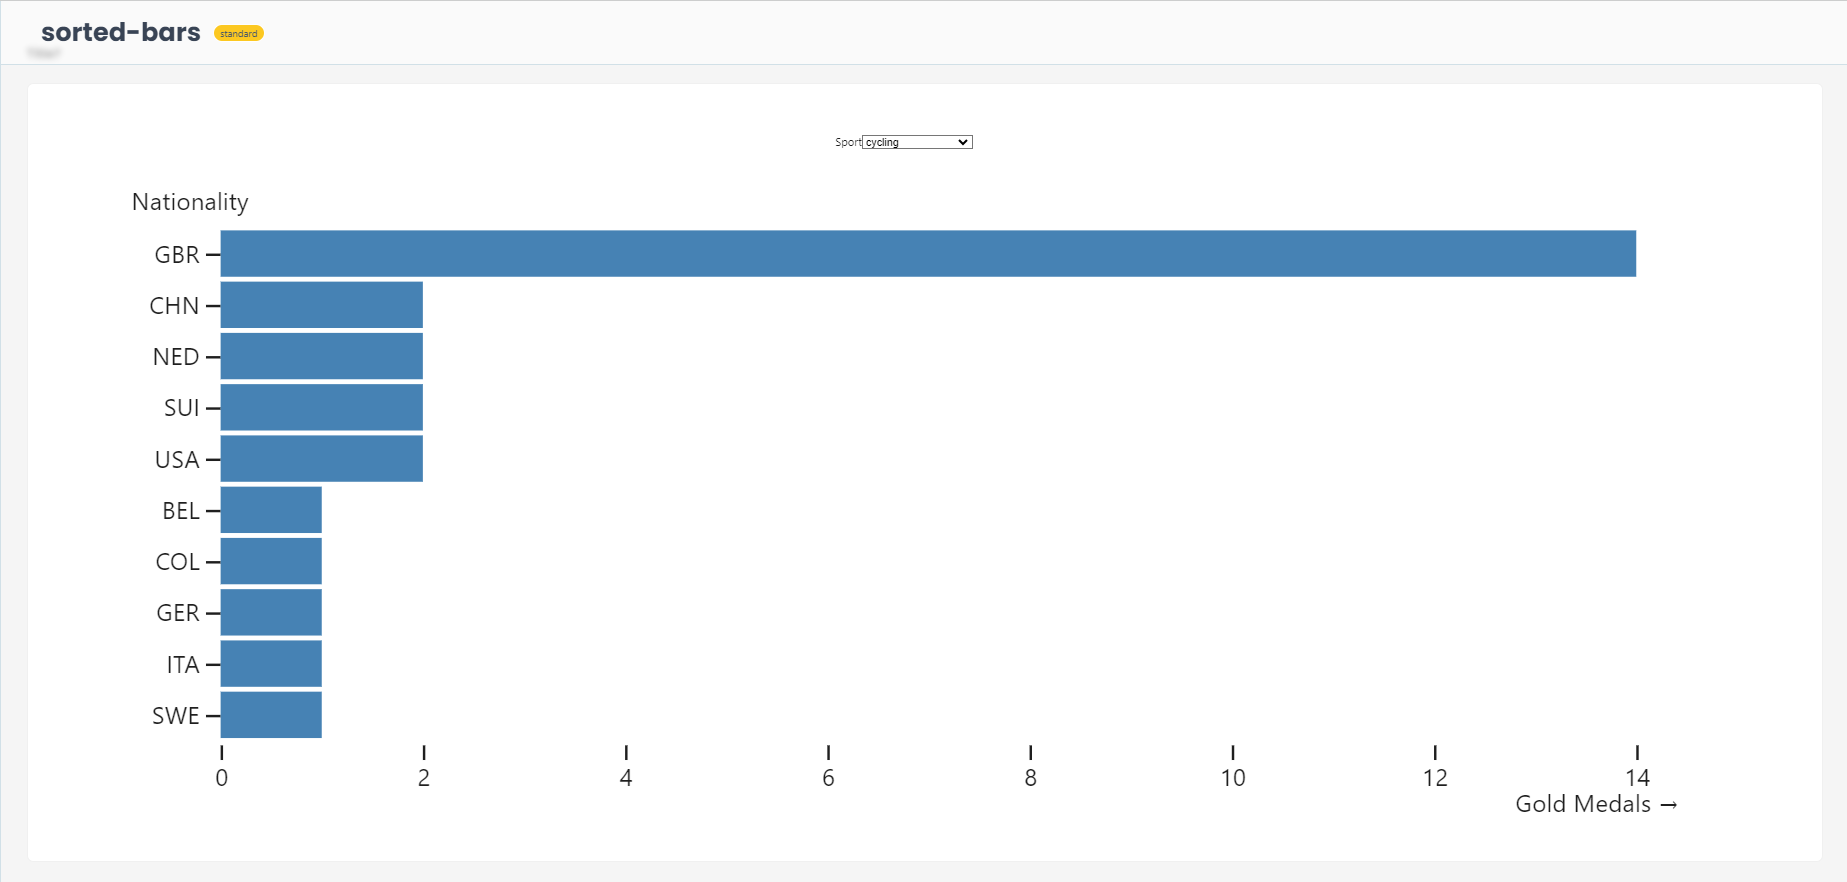
The app loads a dataset of athletes and displays a mosaic plot that shows the relationship between athelete's weight and height using the associated features in the dataset.
Data is available at Kaggle - Olympics: Athletes and Results.
-
Users can filter the data by sport, results and athlete names.
-
The app also displays a table that shows the details of the athletes.
from shapelets.apps import dataApp, vg

app = dataApp()

athletes = app.sandbox.from_parquet('athletes', ['athletes.parquet'])

query = vg.params.intersect()

app.mosaic(
    vg.layouts.vconcat(
        vg.inputs.menu(label='Sport', as_=query, from_=athletes, column='sport', value='aquatics'),
        vg.layouts.vspace(10),
        vg.plot(
            vg.marks.barX(athletes, query, x=vg.transforms.sum('gold'), y='nationality', fill='steelblue', sort={'y': '-x', 'limit': 10}),
            xLabel='Gold Medals',
            yLabel='Nationality',
            yLabelAnchor='top',
            marginTop=15
        )
    )
)