Navigating through
million-datapoint series
NEW POSTby Adrián Carrio
Efficiency and precision in handling extensive data volumes.
The exploding number of connected devices and sensors is generating huge amounts of information across the industrial world and through the everyday use of personal devices and home appliances. In parallel, Machine Learning solutions are being adapted to cope more effectively with greater amounts of data which, when properly used, have the potential to provide finer accuracy in their modelling capabilities.
Dealing with large amounts of data that evolve over time is challenging, especially when working with highly granular data and/or long historical records. An easy and too common solution is to simply aggregate or drop some of the data to reduce the number of datapoints. While this might work on some cases depending on the purpose of the analysis and the nature of the data itself, it is in general a dangerous practice which can produce unreliable, biased results.
Beyond 10,000 Points
Market solutions become inefficient with this volume of points
Unfortunately, many of the current software tools and libraries for data visualization push users to work on reduced series, as these solutions show difficulties handling large sets of points and start to become unresponsive when series exceed 10k datapoints.
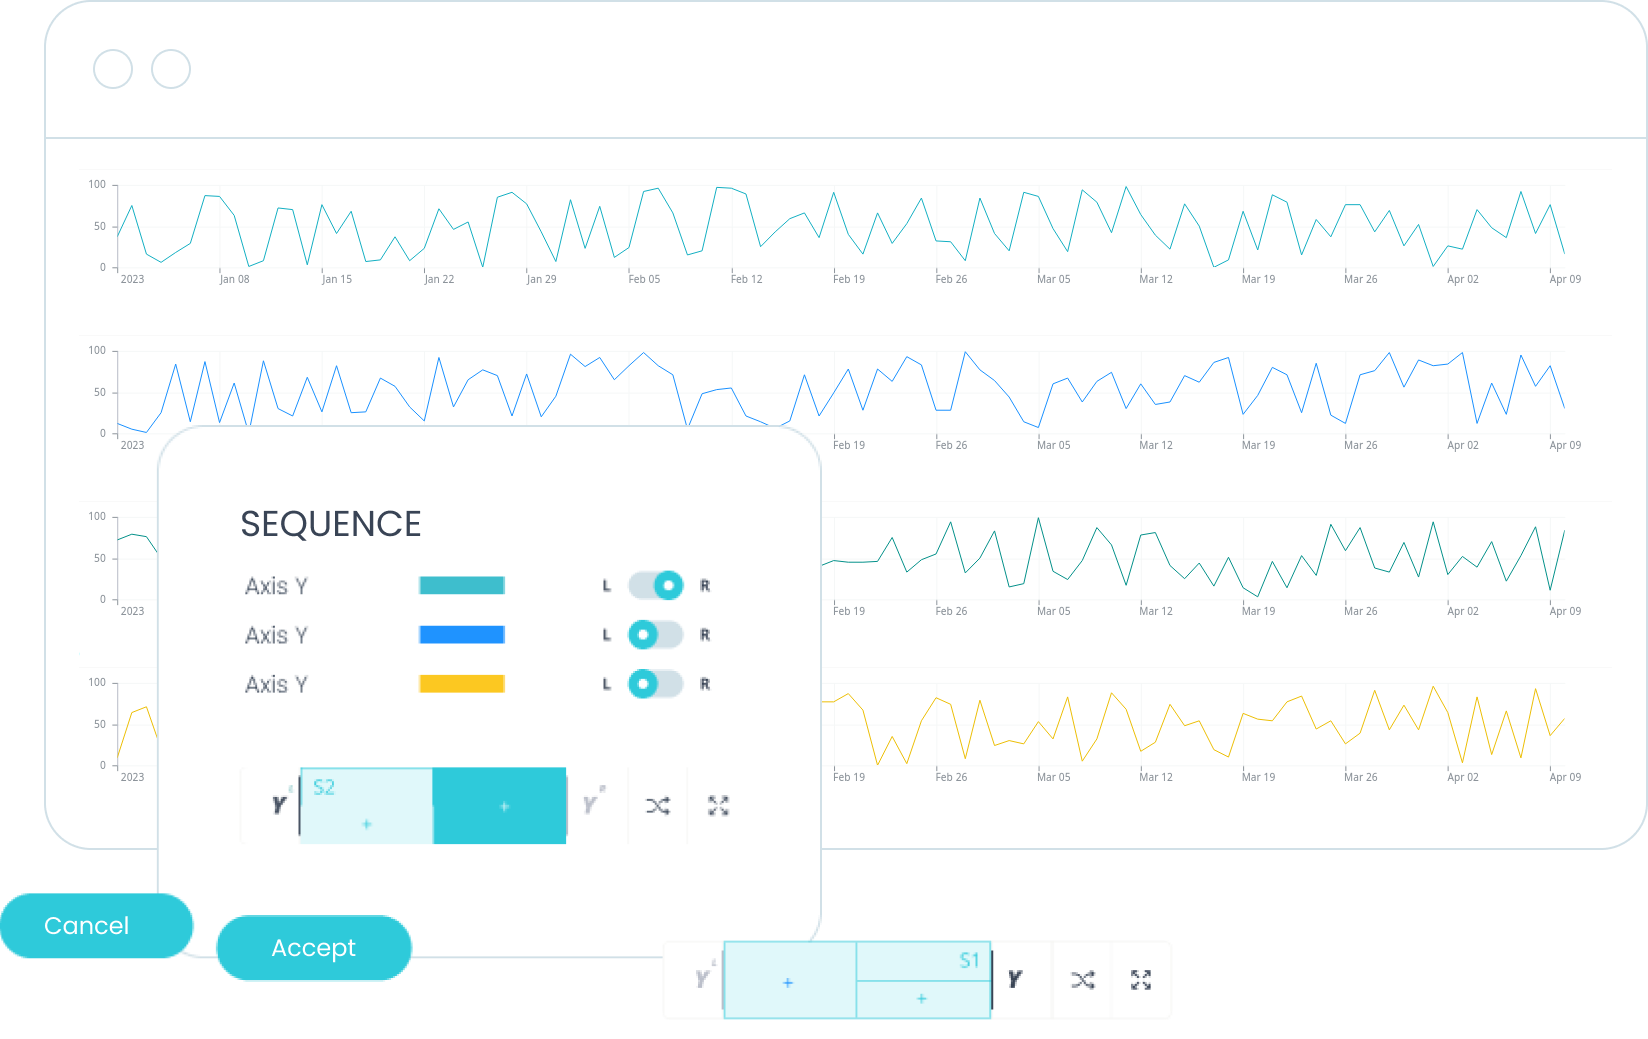
In their continuous objective of accelerating data projects by providing data professionals with the best tools, Shapelets developed shapelets-platform, a python library with extensive features, including one that provides a fast web component to help any user easily and intuitively explore simultaneously multiple million-datapoint series in their browser.

Shapelets API
Components for agile data visualization
Shapelets platform offers a simple python API allowing data scientists to develop professional visualizations or data apps, which consist of a set of interactive components or widgets (e.g. charts, tables, buttons, selectors, etc.) laid out in a particular way and allowing users to interact with the data.
By being able to create and deploy data apps to a corporate environment directly using python only, the construction of data visualization prototypes accelerates from months to hours and the dependence on frontend development teams is no longer a problem.
Data Apps
Just with Python
Data apps may contain multiple types of charts, including charts created using third-party visualization libraries like Altair, Matplotlib or Folium. When the amount of datapoints to explore is large or multiple series need to be explored in parallel, Shapelets platform’s own line-chart widget provides a powerful solution.
It allows to seamlessly drag and zoom in and out of a long series to explore it very quickly. It does not render all the points in the series, but it is able to build a truthful representation of the data showing only a set of actual points in the series (no data aggregation is made).
This set of points changes depending on the view (i.e. on the range of indices and zoom level) is the key that explains its efficiency. Let’s review in more detail how it works under the hood.
line_chart = app.line_chart(title=“Linechart”, data=df)

Ready even before running the Data App
Optimize the visualization and ensure its exploration
The line-chart widget supports multiple series data and the python API with many options to customize its appearance and behaviour, which can be reviewed in the online API documentation.
For the scope of this article, we will focus on a simple example in which a user wants to create a data app to plot one million datapoints stored for example in a column of a Pandas DataFrame.
When the user registers this data app, the whole data app layout, widgets, interactions between widgets and data passed to widgets are encoded into a JSON document and sent from the client to the server. The server then starts processing the series in the background to optimize the visualization and ensure its exploration will run smoothly even before the data app is accessed.
