Interactors
Allows users to create interactive plots.
🔗 Explore Interactors: Parameters and Descriptions
Examples
- All the examples below show the combined use of interactors and other components to create a complete visualization.
Example 1 : Pan and Zoom
from shapelets.apps import dataApp, vg

app = dataApp()

penguins = app.sandbox.from_parquet('penguins', ['penguins.parquet'])

xs = vg.params.intersect()
ys = vg.params.intersect()
zs = vg.params.intersect()
ws = vg.params.intersect()

app.mosaic(
    vg.layouts.hconcat(
        vg.layouts.vconcat(
            vg.plot(
                vg.marks.frame(),
                vg.marks.dot(penguins, x='bill_length', y='bill_depth', fill='species', r=2, clip=True),
                vg.interactors.panZoom(x=xs, y=ys),
                width=650,
                height=300
            ),
            vg.layouts.vspace(10),
            vg.plot(
                vg.marks.frame(),
                vg.marks.dot(penguins, x='bill_length', y='flipper_length', fill='species', r=2, clip=True),
                vg.interactors.panZoom(x=xs, y=zs),
                width=650,
                height=300
            )
        ),
        vg.layouts.hspace(10),
        vg.layouts.vconcat(
            vg.plot(
                vg.marks.frame(),
                vg.marks.dot(penguins, x='body_mass', y='bill_depth', fill='species', r=2, clip=True),
                vg.interactors.panZoom(x=ws, y=ys),
                width=650,
                height=300
            ),
            vg.layouts.vspace(10),
            vg.plot(
                vg.marks.frame(),
                vg.marks.dot(penguins, x='body_mass', y='flipper_length', fill='species', r=2, clip=True),
                vg.interactors.panZoom(x=ws, y=zs),
                width=650,
                height=300
            )
        )
    )
)
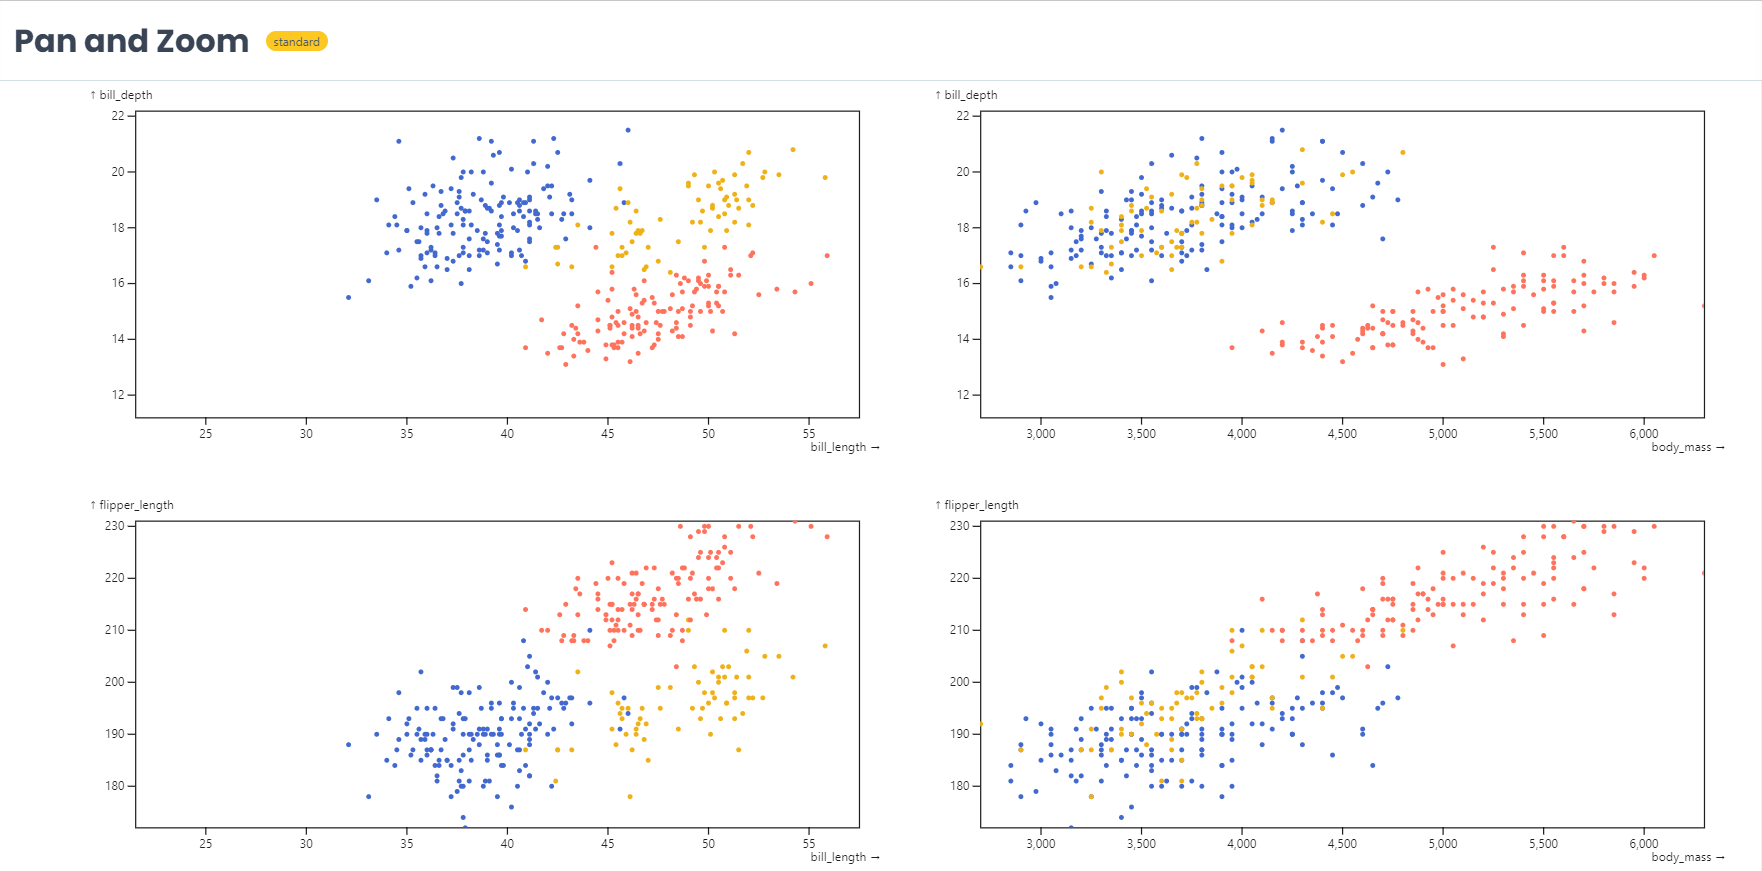
- The first picture shows the layout of the plots with the pan and zoom interactors.
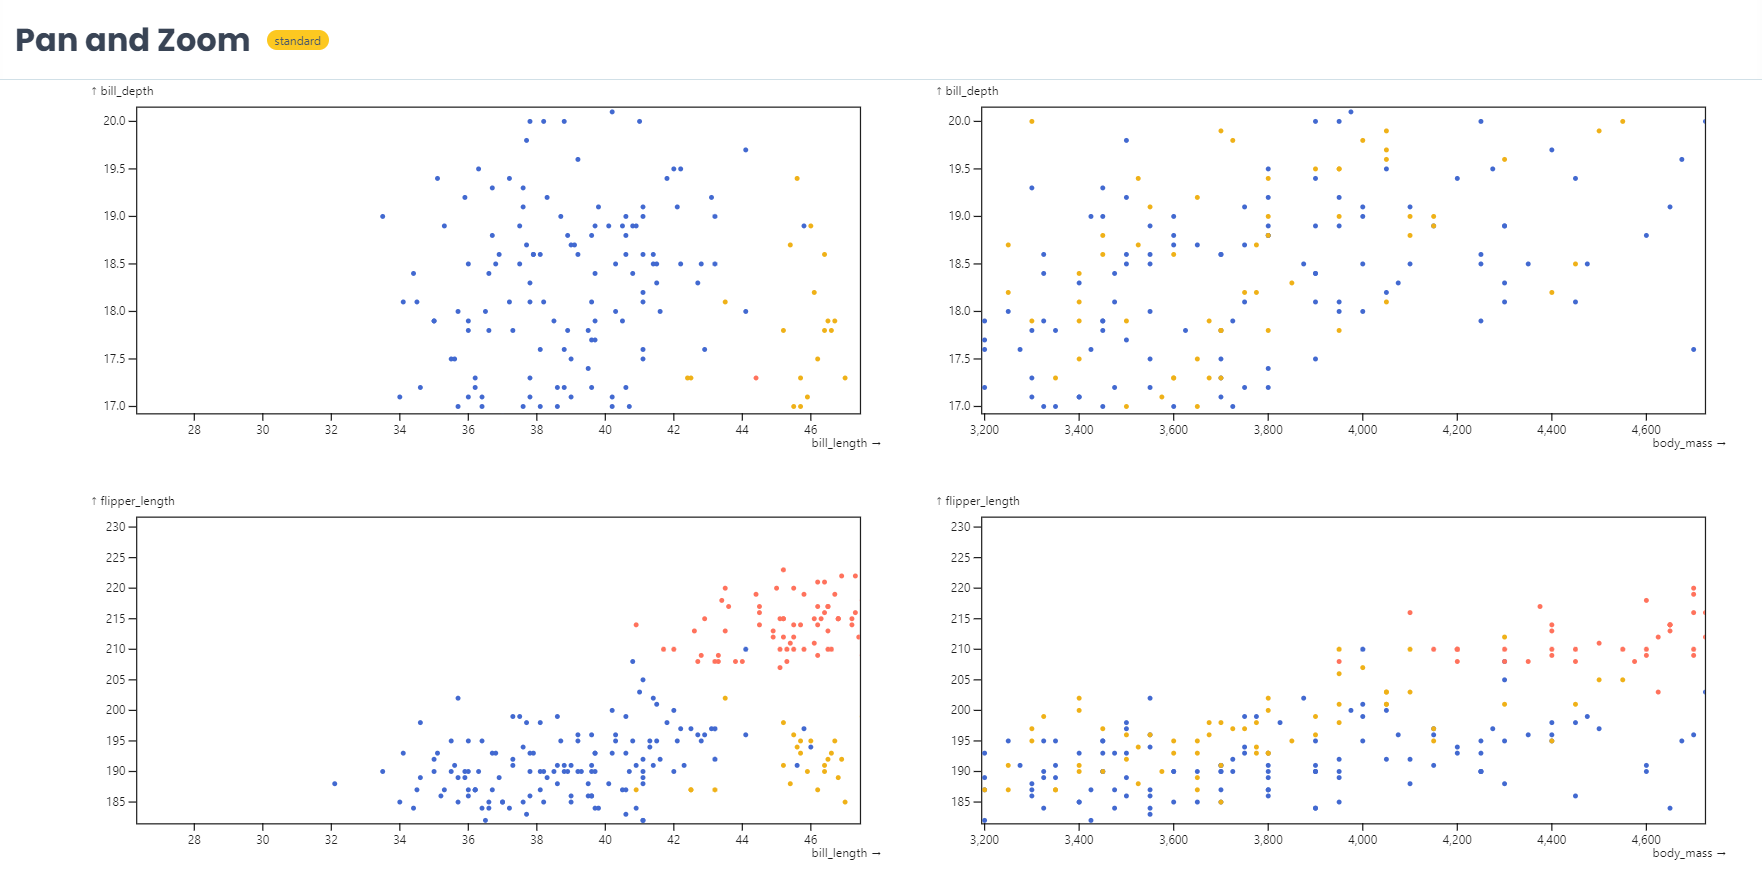
- The second picture shows how we could use the zoom and pan interactors to create a more detailed view of the data.
Example 2 : Observable-Latency using Intervals, Toggles and Highlight.
from shapelets.apps import dataApp, vg

app = dataApp()

latency = app.sandbox.from_parquet('latency', ['observable-latency.parquet'])

filter = vg.params.crossfilter()
highlight = vg.params.intersect()

app.mosaic(
    vg.layouts.vconcat(
        vg.plot(
            vg.marks.frame(fill='black'),
            vg.marks.raster(latency, filter,
                            x='time',
                            y='latency',
                            fill=vg.transforms.argmax('route', 'count'),
                            fillOpacity=vg.transforms.sum('count'),
                            width=2016,
                            height=500,
                            imageRendering='pixelated'),
            vg.interactors.intervalXY(as_=filter),
            colorDomain='Fixed',
            colorScheme='Observable10',
            opacityDomain=[0, 25],
            opacityClamp=True,
            yScale='log',
            yLabel='↑ Duration (ms)',
            yDomain=[0.5, 10000],
            yTickFormat='s',
            xScale='utc',
            xLabel=None,
            xDomain=[1706227200000, 1706832000000],
            width=680,
            height=300,
            margins={'left': 35, 'top': 20, 'bottom': 30, 'right': 20}
        ),
        vg.plot(
            vg.marks.barX(latency, filter, x=vg.transforms.sum('count'), y='route', fill='route', sort={'y': '-x', 'limit': 15}),
            vg.interactors.toggleY(as_=filter),
            vg.interactors.toggleY(as_=highlight),
            vg.interactors.highlight(by=highlight),
            colorDomain='Fixed',
            xLabel='Routes by Total Requests',
            xTickFormat='s',
            yLabel=None,
            width=680,
            height=300,
            marginTop=5,
            marginLeft=220,
            marginBottom=35
        )
    )
)
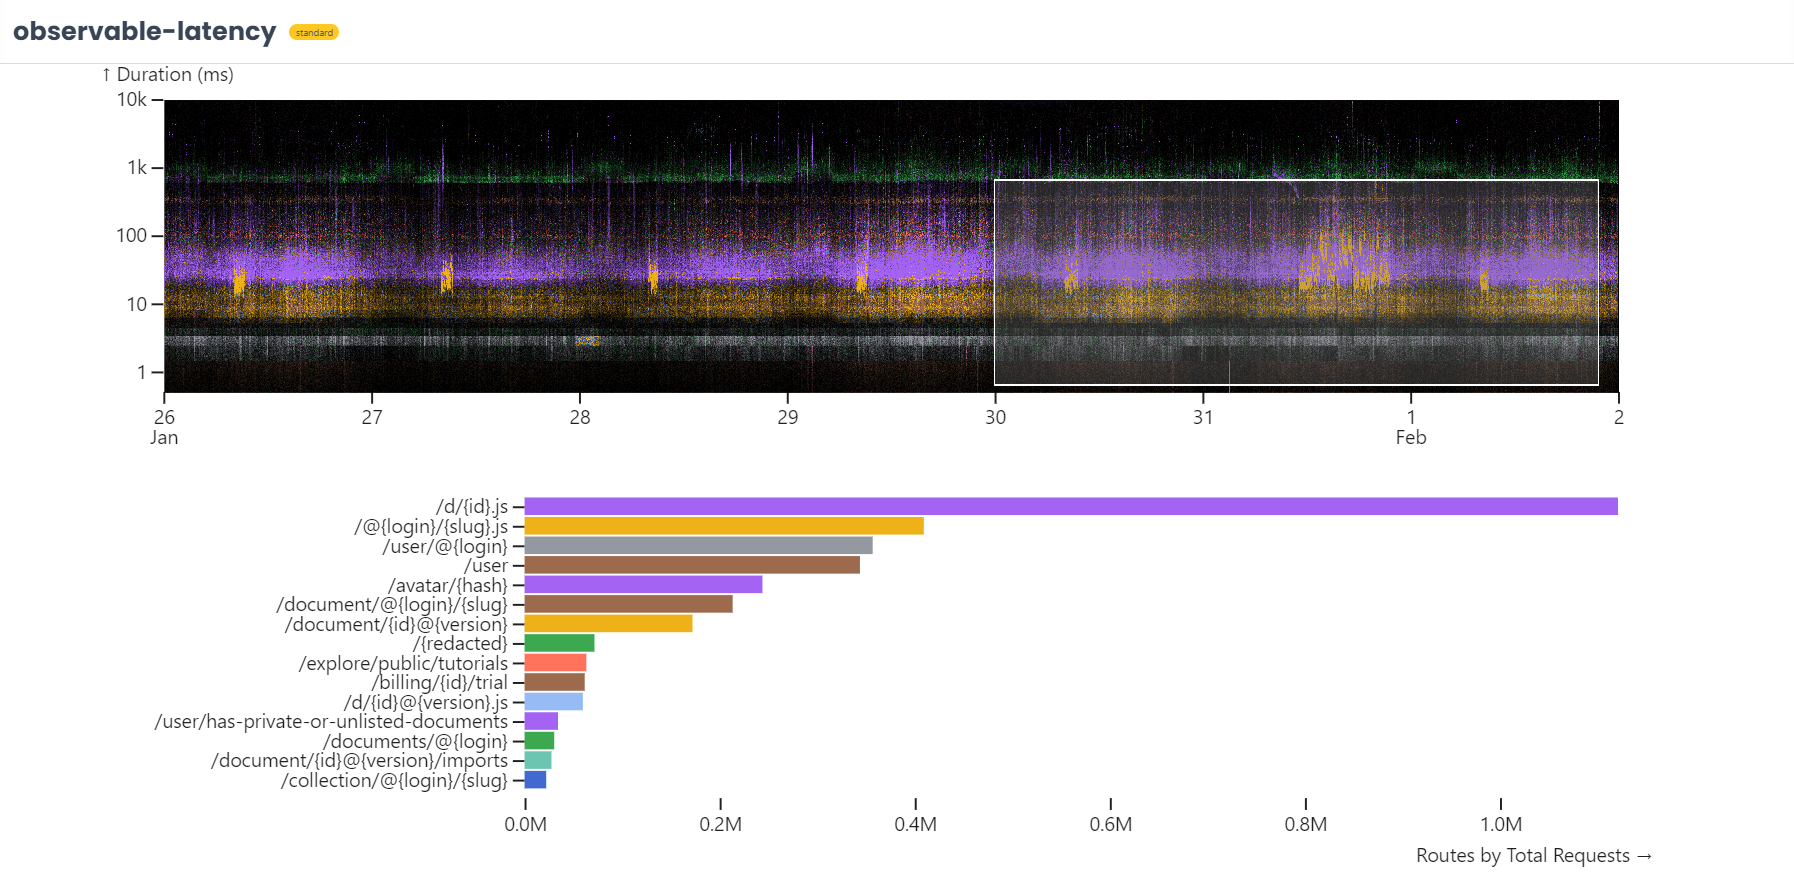
- The first picture shows the comparison of the latency with two different plots. The first plot shows the latency of the routes over time, and the second plot shows the routes by the total requests.
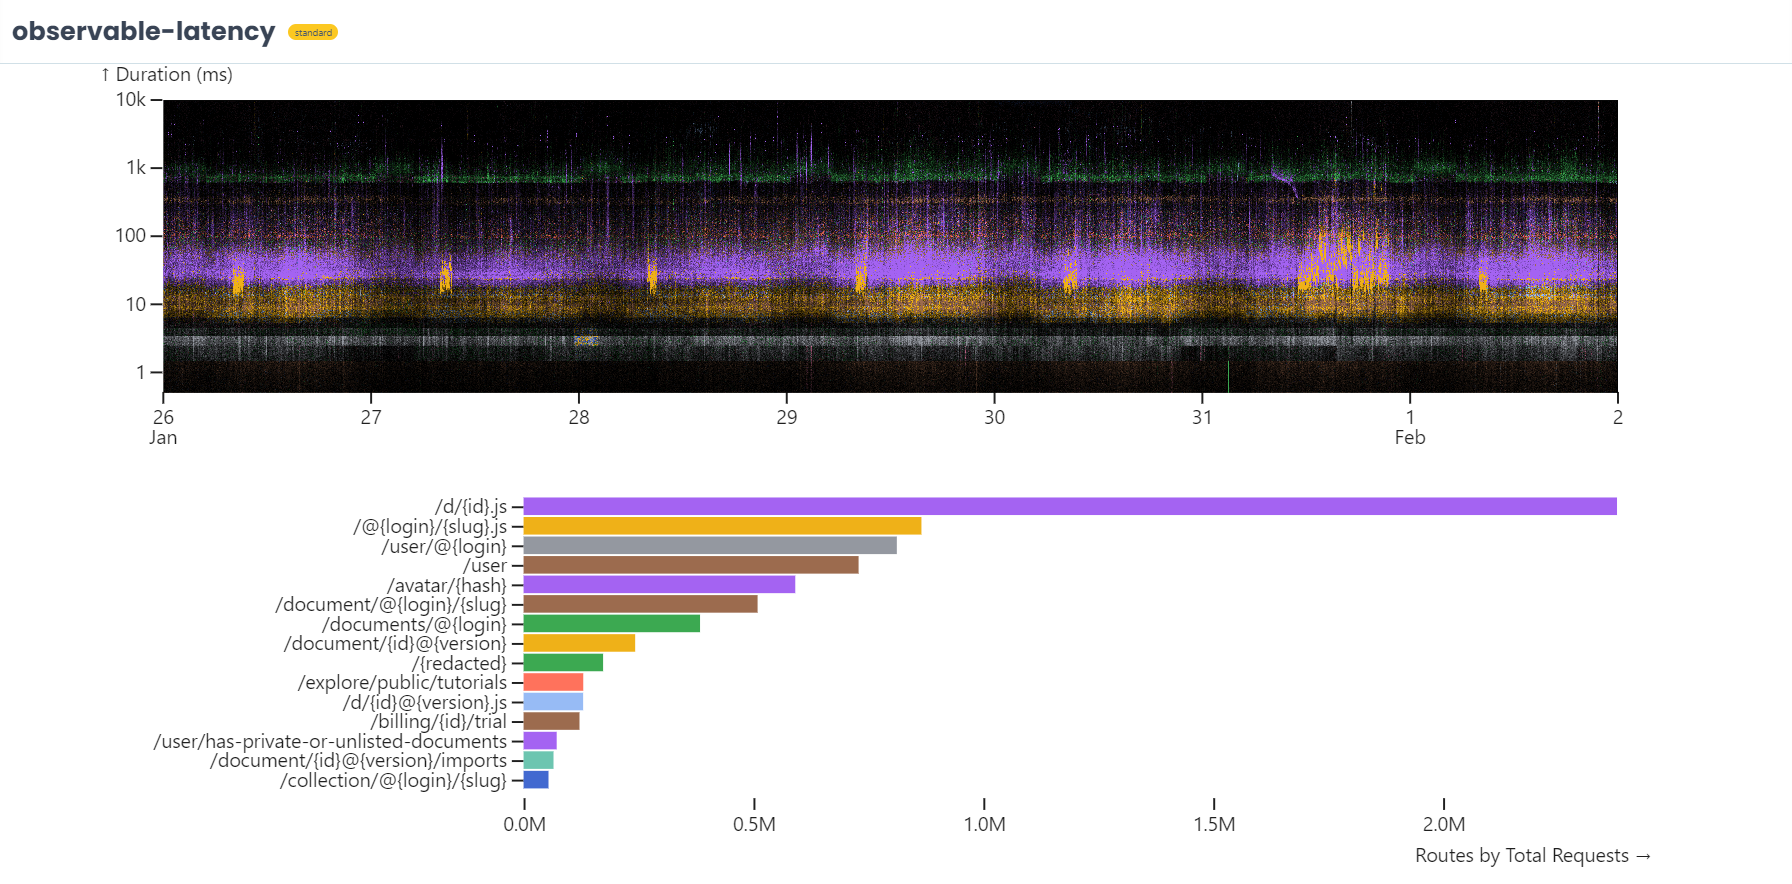
- This picture shows the option to interact with the first plot to observe the shifts in the second plot.