Marks
Allows users to visualise data through graphical elements.
-
Graphical elements that visualise data through the use of shapes, colors, and sizes.
-
For detailed information about the marks component and its comprehensive features, check out the dedicated documentation page below:
🔗 Explore Marks: Parameters and Descriptions
Examples
- All the examples below show the combined use of marks and other components to create a complete visualization.
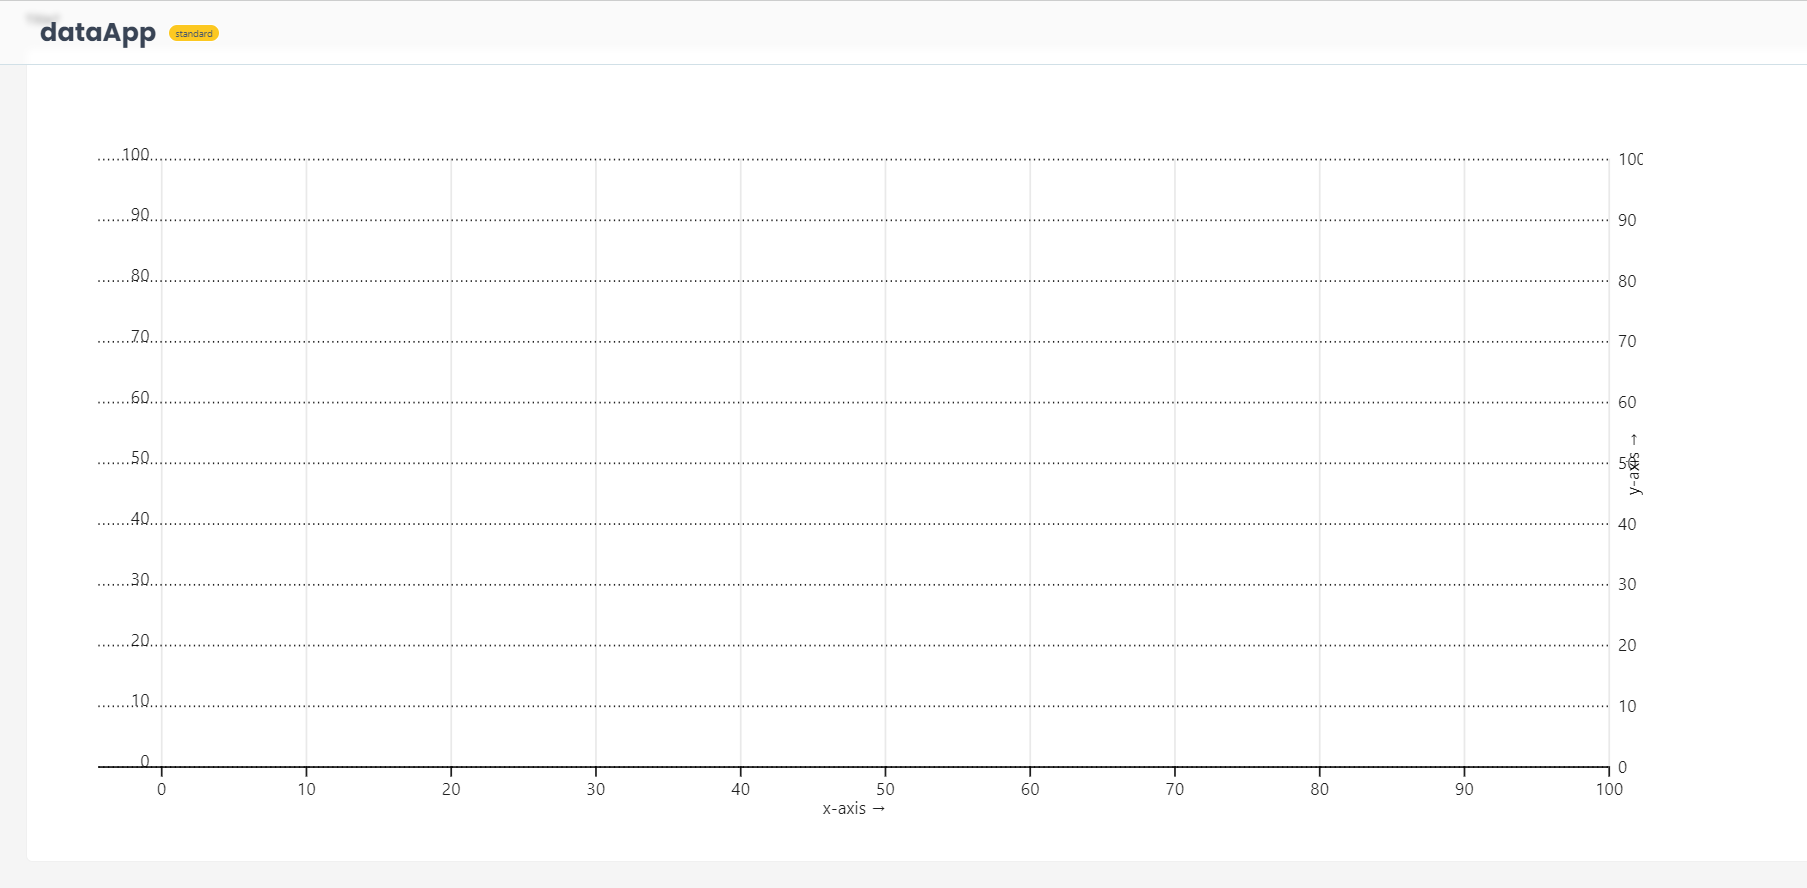
Example 1 : Axis
from shapelets.apps import dataApp, vg

app = dataApp()

app.title("Axes")

app.mosaic(
    vg.plot(
        vg.marks.gridY(strokeDasharray='0.75 2', strokeOpacity=1),
        vg.marks.axisY(anchor='left', tickSize=0, dx=38, lineAnchor='bottom'),
        vg.marks.axisY(anchor='right', tickSize=0, tickPadding=5, label='y-axis', labelAnchor='center'),
        vg.marks.axisX(label='x-axis', labelAnchor='center'),
        vg.marks.gridX(),
        vg.marks.ruleY([0]),
        xDomain=[0, 100],
        yDomain=[0, 100],
        xInsetLeft=36,
        marginLeft=10,
        marginRight=20,
        width=900,
        height=400
    )
)
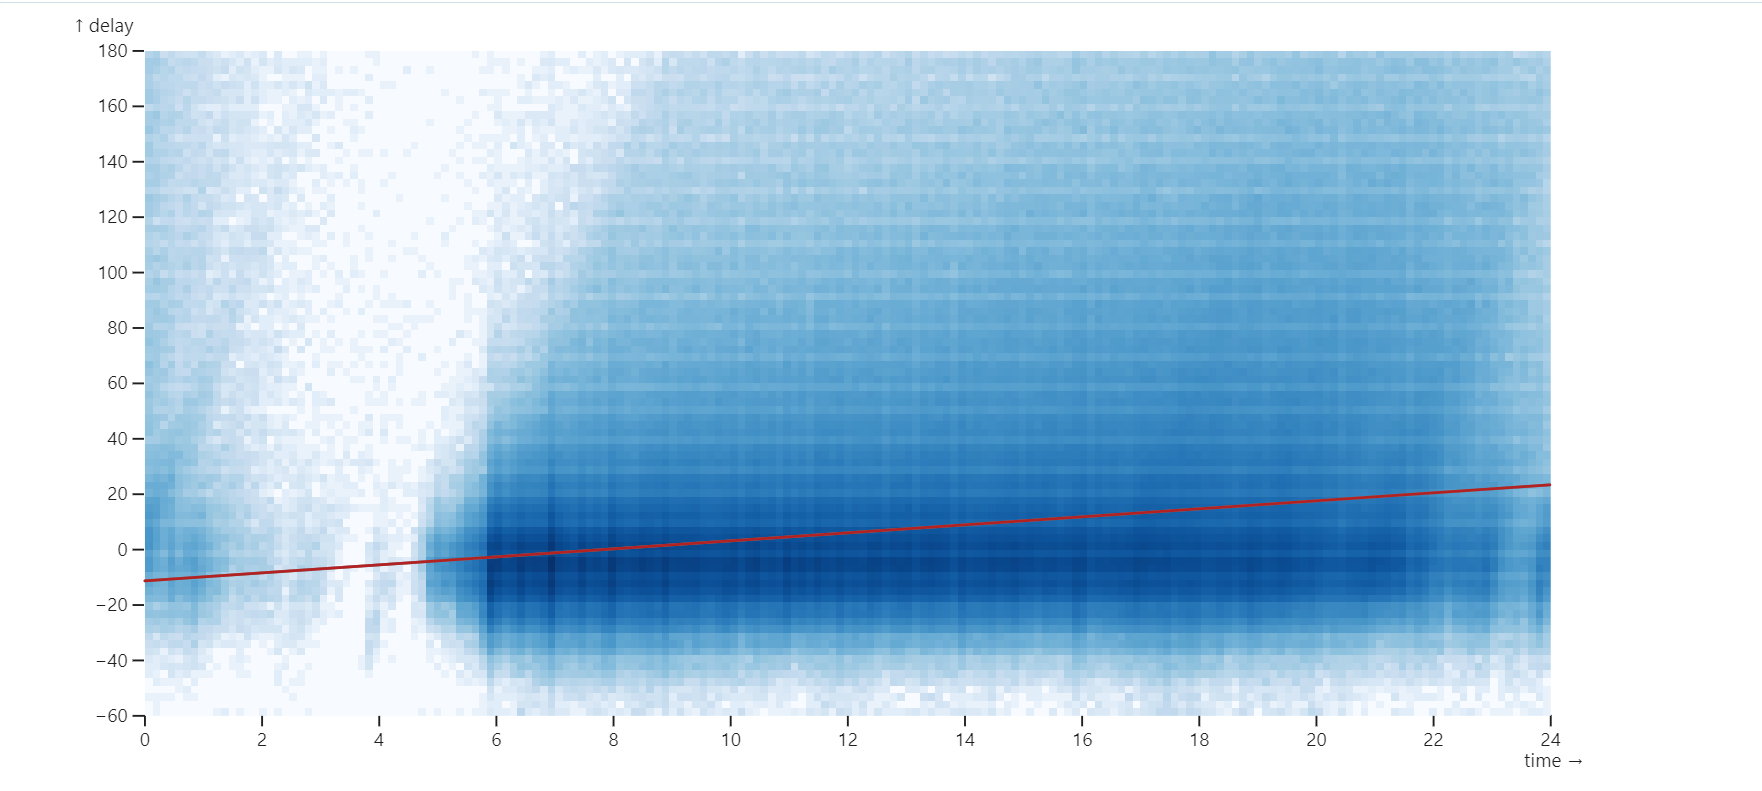
Example 2 : Linear Regression
from shapelets.apps import dataApp, vg

app = dataApp()

# Filter the data
flights = app.sandbox.from_parquet('flights', ['flights-10m.parquet'])
ds = app.sandbox.from_sql("""
    SELECT
        GREATEST(-60, LEAST(ARR_DELAY, 180))::DOUBLE AS delay,
        DISTANCE AS distance,
        DEP_TIME AS time
    FROM
        flights
""").materialize('ds')


query = vg.params.intersect()

app.mosaic(
    vg.plot(
        vg.marks.raster(ds, x='time', y='delay', pixelSize=4, pad=0, imageRendering='pixelated'),
        vg.marks.regressionY(ds, x='time', y='delay', stroke='gray'),
        vg.marks.regressionY(ds, query, x='time', y='delay', stroke='firebrick'),
        vg.interactors.intervalXY(as_=query, brush={'fillOpacity': 0, 'stroke': 'currentColor'}),
        xDomain=[0, 24],
        yDomain=[-60, 180],
        colorScale='symlog',
        colorScheme='Blues',
        width=850
    )
)
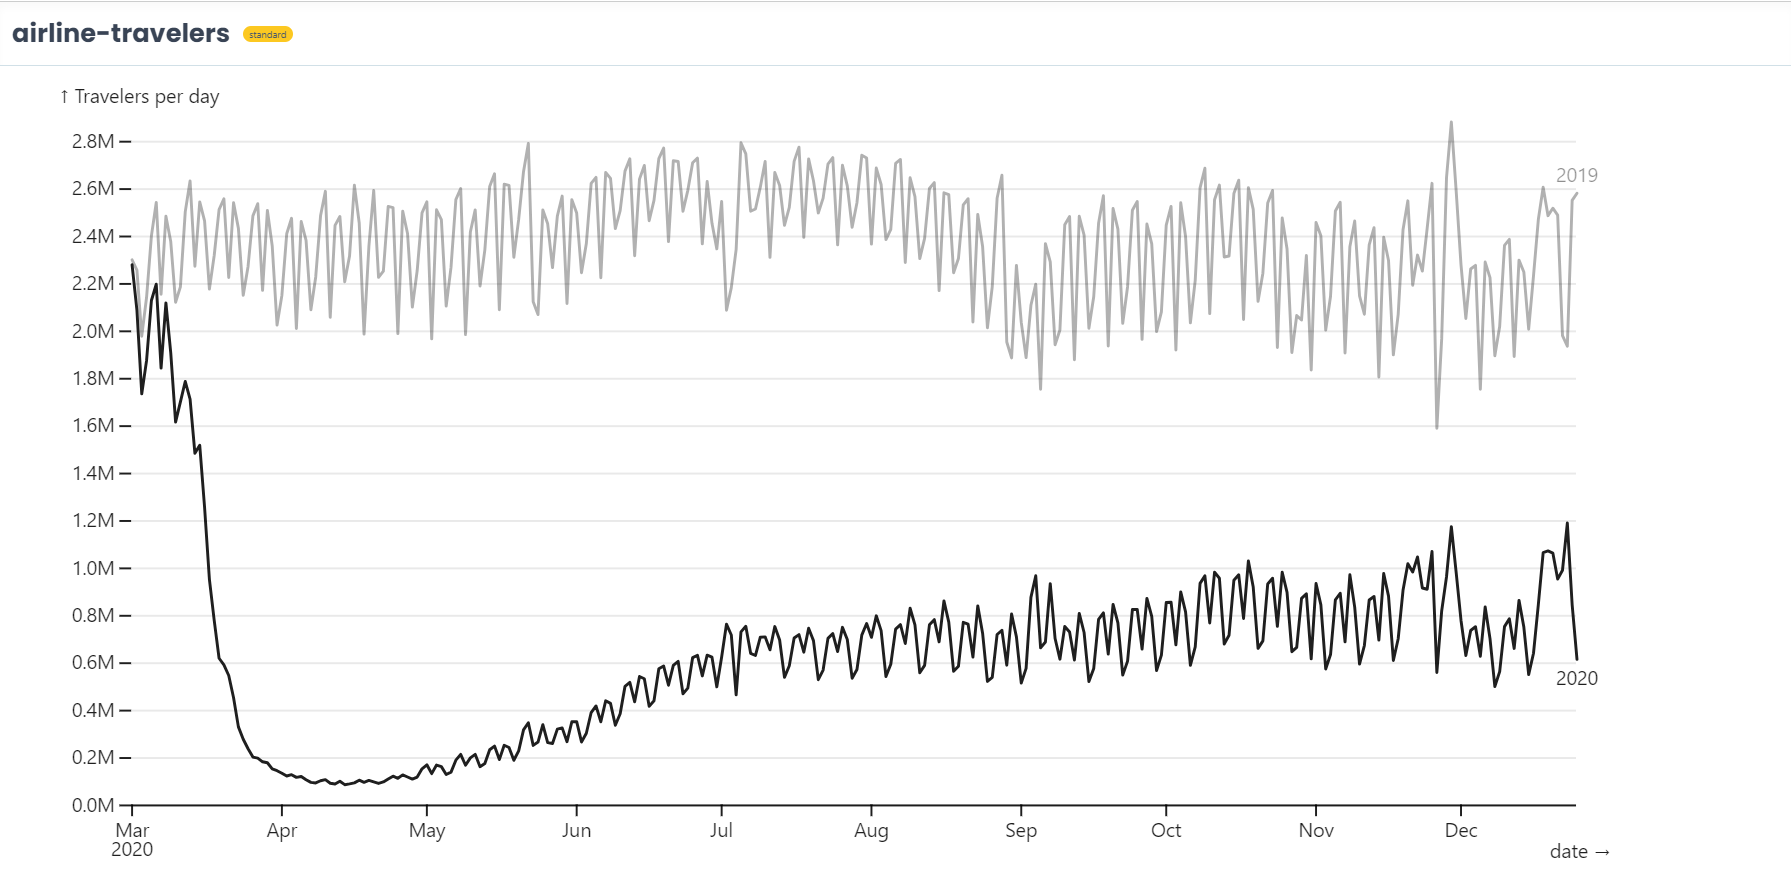
Example 3 : Airline Travelers
from shapelets.apps import dataApp, vg, mosaic

app = dataApp()

travelers = app.sandbox.from_parquet('travelers', ['travelers.parquet'])
endpoint = app.sandbox.from_sql("select * from travelers order by date desc limit 1").with_name("endpoint")

app.mosaic(
    vg.plot(
        vg.marks.ruleY([0]),
        vg.marks.lineY(travelers, x="date", y="previous", strokeOpacity=0.35),
        vg.marks.lineY(travelers, x="date", y="current"),
        vg.marks.text(endpoint, x="date", y="previous", text=["2019"], fillOpacity=0.5, lineAnchor='bottom', dy=-6),
        vg.marks.text(endpoint, x="date", y="current", text=["2020"], lineAnchor='top', dy=6),
        yGrid=True,
        yLabel="↑ Travelers per day",
        yTickFormat='s',
        width=800
    )
)