Layouts
Allows users to create dashboard displays.
🔗 Explore Layout: Parameters and Descriptions
Examples
Example 1 : Using each of the componenets in the layout
from shapelets.apps import dataApp, vg

app = dataApp()

ca55 = app.sandbox.from_parquet('ca55', ['ca55-south.parquet'])

interp = vg.params.value("random-walk")
blur = vg.params.value(0)

app.mosaic(
    vg.layouts.vconcat(
        vg.layouts.hconcat(
            vg.inputs.menu(label='Interpolation Method ', options=['none', 'nearest', 'barycentric', 'random-walk'], as_=interp),
            vg.layouts.hspace('3em'),
            vg.inputs.slider(label='Blur', min=0, max=100, as_=blur)
        ),
        vg.layouts.vspace('1em'),
        vg.plot(
            vg.marks.raster(ca55, x='LONGITUDE', y='LATITUDE', fill=vg.transforms.max('MAG_IGRF90'), interpolate=interp, bandwidth=blur),
            width=900,
            height=390,
            colorScale='diverging',
            colorDomain='Fixed'
        )
    )
)
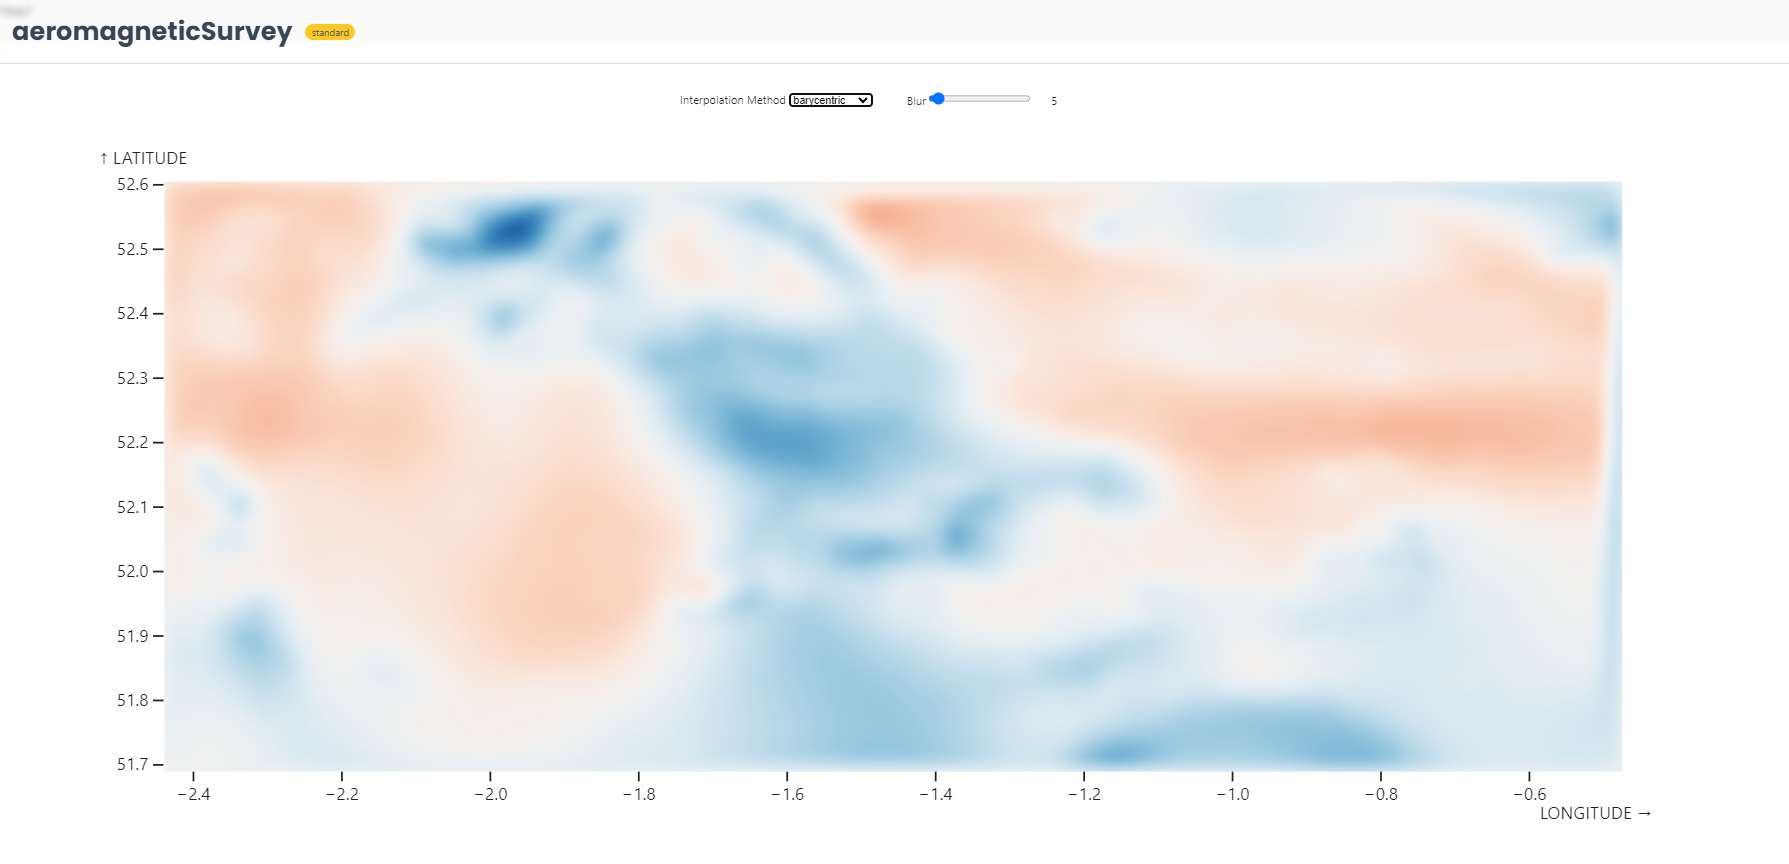
- The widget allows users to generate a raster plot of the data, allowing interactive control over interpolation and blur.
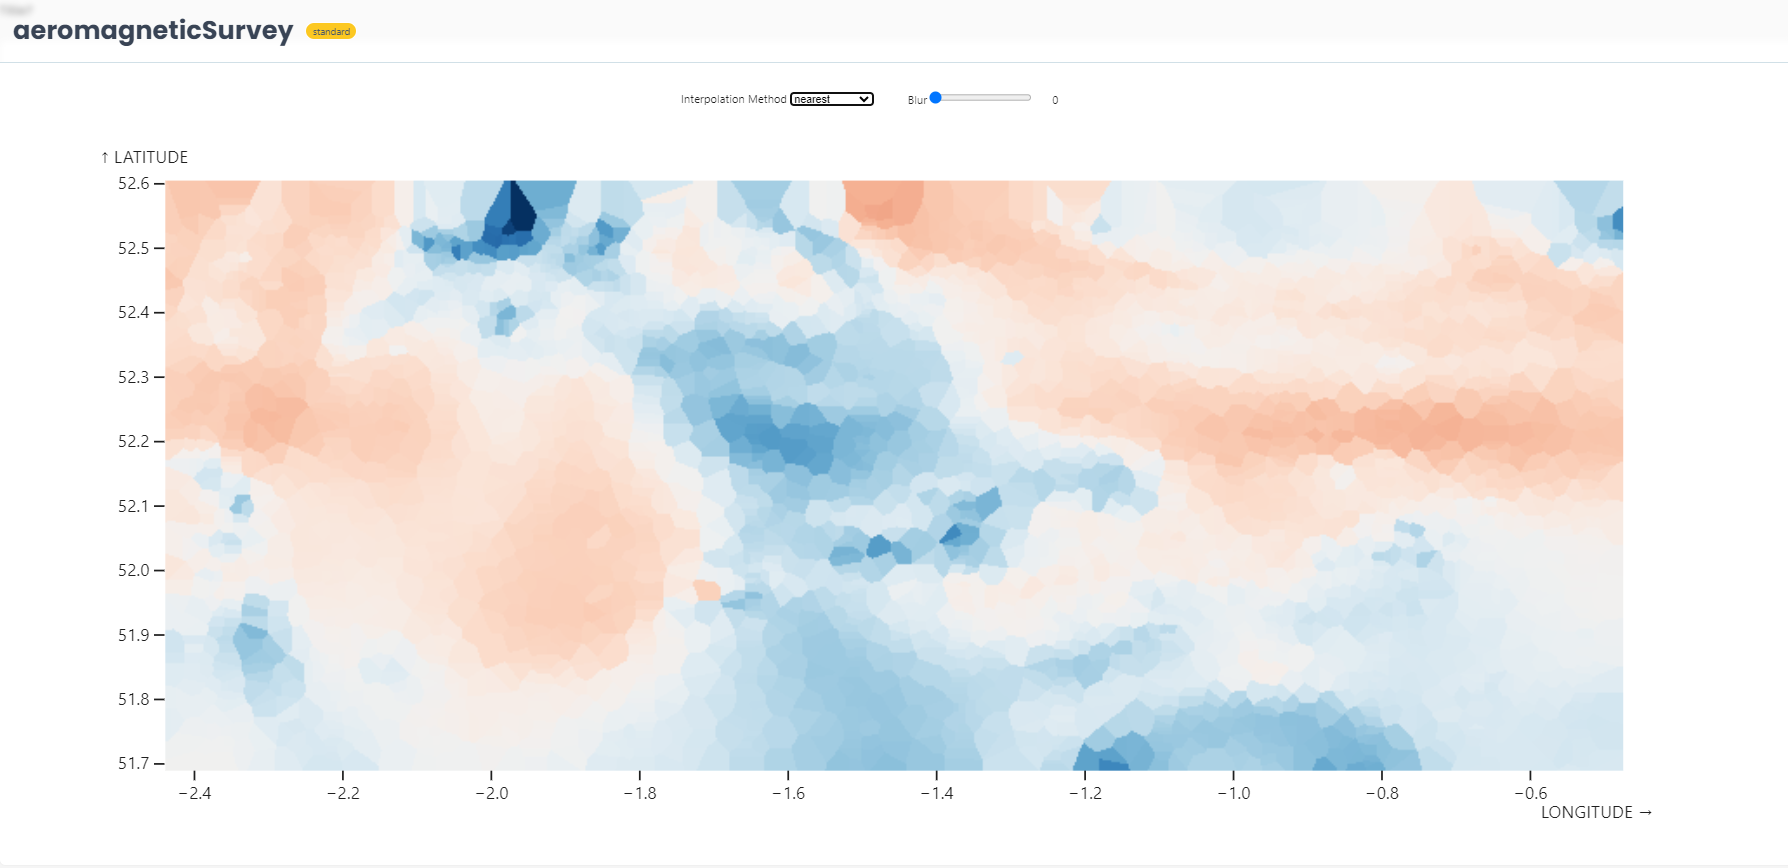
- This image displays how the effect of filters change the outlook of graph.